- Software
- Open access
- Published:
svapls: an R package to correct for hidden factors of variability in gene expression studies
BMC Bioinformatics volume 14, Article number: 236 (2013)
Abstract
Background
Hidden variability is a fundamentally important issue in the context of gene expression studies. Collected tissue samples may have a wide variety of hidden effects that may alter their transcriptional landscape significantly. As a result their actual differential expression pattern can be potentially distorted, leading to inaccurate results from a genome-wide testing for the important transcripts.
Results
We present an R package svapls that can be used to identify several types of unknown sample-specific sources of heterogeneity in a gene expression study and adjust for them in order to provide a more accurate inference on the original expression pattern of the genes over different varieties of samples. The proposed method implements Partial Least Squares regression to extract the hidden signals of sample-specific heterogeneity in the data and uses them to find the genes that are actually correlated with the phenotype of interest. We also compare our package with three other popular softwares for testing differential gene expression along with a detailed illustration on the widely popular Golub dataset. Results from the sensitivity analyes on simulated data with widely different hidden variation patterns reveal the improved detection power of our R package compared to the other softwares along with reasonably smaller error rates. Application on the real-life dataset exhibits the efficacy of the R package in detecting potential batch effects from the dataset.
Conclusions
Overall, Our R package provides the user with a simplified framework for analyzing gene expression data with a wide range of hidden variation patterns and delivering a differential gene expression analysis with substantially improved power and accuracy.
The R package svapls is freely available at http://cran.r-project.org/web/packages/svapls/index.html.
Background
Several types of subject/sample specific factors constitute an important but often overlooked source of hidden variability in differential gene expression analyses. In a wide variety of situations these factors are triggered from certain specific biological, environmental or demographic profiles of the subjects corresponding to the collected tissue samples. The latent effects from these hidden factors can generate spurious signals of heterogeneity that may significantly distort the original differential expression pattern of the genes. In this context, a simple example is provided by the widely known batch-effect in microarray analyses, where subject tissue samples collected in separate batches can produce an additional effect of residual variation. This effect is still manageable as composition of the batches are known prior to analyses. But, numerous other factors may still exist that are not detectable from outside, but can potentially affect the subject-specific expression levels of the genes in different ways. They can in turn lead to complex latent expression structures in the entire genomic landscape of the data (e.g., confounded signals between the two groups of samples, correlated expression signals corresponding to a specific group of genes and samples affected by the hidden factors, etc.). The contributed impact of these factors, either acting singly or in consort can induce serious problems in multiple testing of differential expression for the genes. Thus, a number of truly significant genes can pass out undetected while many others may be wrongly flagged as positives. The consequence is a severe reduction in power (sensitivity) of the testing procedure accompanied by a substantially high rate of erroneous discoveries. Most of available softwares for differential gene expression analyses either overlook this broadly general issue of hidden variability or consider simple parametric regression approaches (linear regression, mixed effects models, etc.) to address the maladies of residual heterogeneity. However the complexity of problem necessitates the development of a more generalized and efficient technique that can identify these latent effects of variation in the data and adjust for them in order to deliver a more powerful and accurate inference on the actual expression pattern of the genes. This motivated us to construct a methodology [1] that provides an unified framework for handling these widely different types of spurious variability in the data.
We have built an R software svapls that uses the multivariate Non-Linear Iterative Partial Least Squares (NIPALS) algorithm [2] to extract the latent, unwanted effects of variation in a gene expression data and uses them to build an optimal ANCOVA model for detecting the truly differentially expressed genes between two types of samples/tissues. In the next section we describe the important functions in our package along with illustrative examples that explain their practical usage in detail. The following section ‘Comparative evaluation with other available software packages’ demonstrates its comparatively superior performance with respect to three other popular softwares: sam[3], limma[4] and sva[5] through a sensitivity analysis of two simulated differential gene expression datasets affected by complicated hidden variation patterns. Section ‘Application on the Golub data’ elucidates an application on a real-life dataset that proves the worth of our software through the adjustment for batch effects and detection of some additional phenotype-related genes that are deemed to be significant from their annotations in the literature. The manuscript ends with a discussion in Section ‘Discussion’.
Implementation
Brief overview of the package
This R package consists of the three primary functions: fitModel, svpls and hfp. Below we give a brief outline of them. The function applications are demonstrated on a simulated dataset affected by hidden variation (hidden_fac.dat) that is inbuilt as a part of the R package.
-
The first function fitModel fits an ANCOVA model to the original log-transformed gene expression data, with a certain number of PLS scores as surrogate variables (specified by n.surr) or the simple ANOVA model [6, 7] if no surrogate variables are specified. This function provides an user with the flexibility of estimating the actual gene-variety interaction effects from a certain ANCOVA model with a specific choice on the number of surrogate variables, which can be selected depending on the complexity of the situation under study.

-
The second function svpls calls the first function fitModel to fit a number of ANCOVA models (specified by pmax) to the data and selects the optimal model as the one with the minimum value of the Akaike’s Information Criterion (AIC) [8]. This model is then used to predict the actual pattern of differential expression of the genes over the two sample varieties by performing a multiple hypothesis testing at specified value of the false discovery rate (FDR) [9] (specified by fdr).

While the Benjamini-Hochberg correction is used by default in our R package the p-values returned by the svpls object provides an user with the flexibility of applying several other FDR controlling techniques and also peforming the more specifically targeted gene set enrichment analyses.
We compute p-values from a differential testing of the genes with the estimated effects from standard ANOVA and the optimal ANCOVA model selected by our R package. A side-by-side plot of their corresponding histograms clearly demostrate the efficacy of the function svpls in our package in terms of the proximity of the set of larger p-values towards the uniform distribution (Figure 1).


-
The third function hfp produces a heatmap for the PLS-imputed estimate of the residual expression heterogeneity corresponding to an user-specified set of genes and samples (specified by gen and ind respectively). This enables us to understand how intensely the latent factors from a certain set of subjects affect the true expression levels of a specified set of genes.
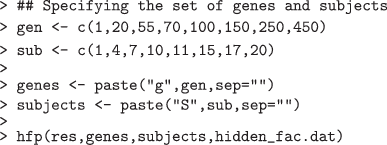
This produces a plot revealing the way the hidden variable affects the expression pattern of the selected group of genes over the specified subjects (Figure 2). Clearly, we can observe a substantial difference in the expression variability caused by the latent factor for subjects and the rest specified under the selected group.
Figure 1 
Histograms of the unadjusted and adjusted p-values. This figure exhibits two histograms from an analysis of the data hidden _fac.dat, one for the unadjusted p-values for testing the variety-based differential gene expression (found from the standard ANOVA model) and the other corresponding to the adjusted p-values obtained after correcting the hidden variability in the data by our R package svapls.
Figure 2 
Heatmap showing the hidden variability in the data hidden_fac.dat owing to the specified set of subjects and genes.


Comparative evaluation with other available software packages
In this section we illustrate the application of the R package along with the other three popular software packages through a family of simlulation analyses conducted with two sample sizes 20 and 40 under three different values of the noise-to-signal ratio (η=0.05,0.1 and 0.15) controlling the relative intensity of the random error and primary signal variances from low to high [1]. In each simulation study we generate correlated expression measurements on 1000 genes over k subjects, (k=20,40) classified equally into two groups 1 and 2. Overall, we consider two different settings: (1) The genes are affected by a highly complex subject-specific confounder (mixture of two normal random variables) with a small variance and (2) The genes are affected by two widely different subject-specific confounders (one mixture of two normal random variables and another mixture of two exponential random variables), both with very high variances [1]. Under both the settings, the first 70 genes are considered to be truly differentially expressed over the two varieties while the rest are chosen as non-significant. The simulation study is based on computation of the average values of two right decision indicators (sensitivity, specificity) and two wrong detection indicators (false discovery rate and false non-discovery rate), evaluated from 1000 Monte-Carlo replications (Tables 1 and 2 for setting 1 and 3,4 for setting 2). The obtained results from the two simulation settings clearly reveal the superior sensitivity of svapls compared to other three R packages sam, limma and sva, under most of the combinations of group size and noise-to-signal ratios. This illustrates the efficiency of our R package in discovering a higher proportion of the truly significant genes compared to the existing software packages. The sensitivity of sam is comparable to our method for a higher sample size under setting 1 (Tables 1 and 2) and is very close or marginally better under setting 2 (Tables 3 and 4), but is adversely impacted by its significantly large false discovery rate. Specifically, the sensitivity obtained from our R package becomes almost similar or slightly better than sam as the group size is increased from 10 to 20 (Table 4). Moreover, the specificity rate is the best for svapls closely followed by sva, while sam and limma are less efficient in this context. In addition, the average error rates FDR and FNR are much lower for svapls compared to the other three software packages. Thus, overall our R package is capable of discovering the truly differentially expressed genes with more power along with an efficient control over the wrong detections (non-detections).
Application on the Golub data
Now, we explore the performance of svapls on the pre-processed ALL/AML dataset [10, 11]. It contains the log-transformed expression levels of 7129 genes over-two groups of patients: 47 having Acute Lymphoblastic Leukemia (ALL) and 25 suffering from Acute Myeloid Leukemia (AML). The patient tissue samples were obtained from the following four sources: (1) Dana-Farber Cancer Institute (DFCI), (2) St-Jude’s Children’s Research Hospital (ST-Jude), (3) Cancer and Leukemia Group B (CALGB) and (4) Children’s Cancer Study Group (CCG). This inherent classification in the data can potentially generate significant batch effects that may distort the original expression pattern of the genes. This motivated the implementation of our R package on this dataset. The corrected expression matrix for the first 1000 genes returned from the use of the svpls function on this data demonstrates that the batch effects due to variability in the sample sources have been removed effectively. The haphazard distribution of the samples from the four sources in the corrected gene expression matrix wipes out the additonal effects owing to the observed batch-specific clustering in the original data. In this context svapls fares equally well compared to another popular R package ber for removing batch effects in microarray data [12] (Figure 3).

(a), (b), (c) Heatmaps showing the original and corrected expression levels for the first 1000 genes in the Golub data. (a) Heatmap for the first 1000 genes in the original Golub expression data. (b) Heatmap for the first 1000 genes in the adjusted Golub expression data obtained by use of the R package ber. (c) Heatmap for the first 1000 genes in the adjusted Golub expression data obtained by the use of our R package svapls.
Overall, limma detects 7128 genes followed by 3307 genes from sam, 1015 genes from our svapls and 412 genes from sva. A Venn diagram (Figure 4) represents the extent of overlap between the genes detected by the four softwares. Specifically, limma detects all the genes that are found to be significant from the other three softwares. This may be attributable to its high false discovery rate (FDR) as was observed in the simulation study. Interestingly, svapls detected 24 genes that are missed by both sam as well as sva. Among them the genes CD74, TNFRSF1A, LCN2 and GSN deserve special mention. All these genes are either related to some type of cancer or regulate cell growth(or apoptosis). CD74 plays an important role in multiple myeloma and its higher expression induces tumor cell malignancy [13]. An isoform of the tumor necrosis factor TNFRSF1A is associated with the development of Acute Lymphoblastic Leukemia (ALL) in children [14]. Specifically, LCN2 has been found to be connected with Acute Myelogenous Leukemia (AML) [15]. GSN plays a significant role of suppressing tumorigenicity in lung cancer [16] and has a diminuted expression in bladder cancer cells [17].

A Venn-diagram showing the overlap pattern of the genes detected to be significant from the Golub data by svapls, sva, sam and limma.
Discussion
Various hidden sources of variation are found to exist in a gene expression data that cannot be removed by the standard normalization procedures. But, their effect may be substantial enough to change the expression pattern of the genes over two different varieties of samples. The immediate consequence is a large reduction in the detection power of the testing procedure employed to find the truly significant genes, followed by highly elevated error rates. In this project we discuss the development and usage of an R package svapls that can tackle a wide variety of hidden effects in a gene expression analysis and can deliver a more accurate inference on the differential expression variability of the genes between two groups of samples (tissues). We illustrate the superior performance of our R package in comparison to three other popular softwares available for differential gene expression analyses. The high detection power (sensitivity) of svapls along with the reasonably small error rates provides it a significantly better edge over the competing softwares. Specifically, sva is outperformed by our package in terms of the sensitivity (power), while sam comes close and performs marginally better in some cases, although its competence is severely marred by the considerably high false discovery rate (FDR) and substantially low specificity rate. In addition the graphical representation of the hidden variation (by the function hfp) from our package enables the user to understand the pattern in which the hidden sources of variability affect the expression signals of any specified subset of genes over a selected group of subjects/samples. This paves the way to more sophisticated analyses of subject-set specific gene expression variability in the data. Application of our package on the Golub data demonstrates its efficacy in removing the significant batch effects from the collected/analyzed samples. Moreover our package detects four additional genes (missed by both sva and sam) that have been found to be connected to Leukemia or some other type of cancer.
Conclusions
The R package svapls can detect a wide variety of hidden factors in a gene expression study and adjust for them appropriately, in order to provide a more accurate inference on the expression pattern of the genes between two different types of tissues. In particular, the superior detection power and small error rate gives our R package a substantially better edge over the competing softwares considered in the analysis.
Availability and requirements
Project name
R packagesvapls
Project home page
http://cran.rproject.org/web/packages/svapls/index.html
Operating system and R version
The R package is platform independent and is compatible with all the versions of R same as or higher than 2.0.
License
GPL-3
References
Chakraborty S, Datta S, Datta S: Surrogate variable analysis using partial least squares in gene expression studies. Bioinformatics. 2012, 28 (6): 799-806. 10.1093/bioinformatics/bts022.
Geladi P, Kowalski B: Partial, least squares regression: a tutorial. Analytica Chimica Acta. 1986, 185: 1-17.
Tusher V, Tibshirani R, Chu G: Significance analysis of microarrays applied to the ionizing radiation response. Proc Natl Acad Sci. 2001, 98: 5116-5121. 10.1073/pnas.091062498.
Smith GK: Limma: linear models for microarray data. Bioinformatics and Computational Biology Solutions using R and Bioconductor. Edited by: Gentleman R, Carey V, Dudoit S, Irizarry R, Huber W. 2002, New York: Springer
Leek ST, et al: The sva package for removing batch effects and other unwanted variation in high-throughput experiments. Bioinformatics. 2012, 28 (6): 882-883. 10.1093/bioinformatics/bts034.
Kerr MK, et al: Analysis of variance for gene expression microarray data. J Comput Biol. 2000, 7: 819-837. 10.1089/10665270050514954.
Kerr MK, et al: Statistical analysis of a gene expression microarray data. Stat Sinica. 2002, 12 (1): 203-217.
Hirotsugu A: Likelihood and the Bayes procedure. Bayesian Statistics. Edited by: Bernardo JM, De Groot MH, Lindley DV, Smith AFM. 1980, Valencia, Spain: University Press, 143-203.
Benjamini Y, Hochberg Y: Controlling the false discovery rate: a practical and powerful approach to multiple testing. J R Stat Soc. 1995, 57 (1): 289-300.
Golub T, et al: Molecular classification of cancer: class discovery and class prediction by gene expression monitoring. Science. 1999, 286: 531-537. 10.1126/science.286.5439.531.
Dudoit S, Friedlyand J, Speed TP: Comparison of discrimination methods for the classification of tumors using gene expression data. J Am Stat Assoc. 2002, 97 (457): 77-87. 10.1198/016214502753479248.
Giordan M: A two-stage procedure for the removal of batch effects in microarray studies. Stat Biosci. 2013, 10.1007/s12561-013-9081-1.
Burton JE: CD74 is expressed by multiple myeloma and is a promising target for therapy. Clin Cancer Res. 2004, 10 (19): 6606-6611. 10.1158/1078-0432.CCR-04-0182.
Wu S: Levels of the soluble, 55-kilodalton isoform of tumor necrosis factor receptor in bone marrow are correlated with the clinical outcome of children with acute lymphoblastic leukemia in first recurrence. Cancer. 2003, 98 (3): 625-631. 10.1002/cncr.11553.
Shimada H, et al: Potential involvement of the AML1-MTG8 fusion protein in the granulocytic maturation characteristic of the t(8:21) acute myelogenous leukemia revealed by microarray analysis. Leukemia. 2002, 16 (5): 874-885. 10.1038/sj.leu.2402465.
Sagawa N, et al: Gelsolin supresses tumorigenicity through inhibiting PKC activation in human lung cancer cell line, PC10. Br J Cancer. 2003, 88 (4): 606-612. 10.1038/sj.bjc.6600739.
Haga K: The mechanism for reduced expression of gelsolin, tumor supressor protein, in bladder cancer. Hokkaido Igaku Zasshi. 2003, 78 (1): 29-37.
Acknowledgements
We sincerely thank the editor and the two reviewers for their constructive comments that lead to an improved manuscript. This research was part of SC’s doctoral dissertation work. SC acknowledges generous support and a dissertation completion award by the School of Interdisciplinary and Graduate Studies of the University of Louisville. We also acknowledge partial support by the Department of Bioinformatics and Biostatistics of University of Louisville toward the processing charges. This research work was partially supported by NIH grants CA133844 (Su. Datta) and CA 170091−01A1 (Su. Datta).
Author information
Authors and Affiliations
Corresponding author
Additional information
Competing interests
The authors declare that they have no competing interests.
Authors’ contributions
SC wrote the R package including its evaluation and drafted the manuscript. SD and SD contributed to the structure of the simulation studies, application and planning of the manuscript. All authors read and approved the final manuscript.
Authors’ original submitted files for images
Below are the links to the authors’ original submitted files for images.
Rights and permissions
This article is published under license to BioMed Central Ltd. This is an Open Access article distributed under the terms of the Creative Commons Attribution License (http://creativecommons.org/licenses/by/2.0), which permits unrestricted use, distribution, and reproduction in any medium, provided the original work is properly cited.
About this article
Cite this article
Chakraborty, S., Datta, S. & Datta, S. svapls: an R package to correct for hidden factors of variability in gene expression studies. BMC Bioinformatics 14, 236 (2013). https://doi.org/10.1186/1471-2105-14-236
Received:
Accepted:
Published:
DOI: https://doi.org/10.1186/1471-2105-14-236