- Software
- Open access
- Published:
MeSH ORA framework: R/Bioconductor packages to support MeSH over-representation analysis
BMC Bioinformatics volume 16, Article number: 45 (2015)
Abstract
Background
In genome-wide studies, over-representation analysis (ORA) against a set of genes is an essential step for biological interpretation. Many gene annotation resources and software platforms for ORA have been proposed. Recently, Medical Subject Headings (MeSH) terms, which are annotations of PubMed documents, have been used for ORA. MeSH enables the extraction of broader meaning from the gene lists and is expected to become an exhaustive annotation resource for ORA. However, the existing MeSH ORA software platforms are still not sufficient for several reasons.
Results
In this work, we developed an original MeSH ORA framework composed of six types of R packages, including MeSH.db, MeSH.AOR.db, MeSH.PCR.db, the org.MeSH.XXX.db-type packages, MeSHDbi, and meshr.
Conclusions
Using our framework, users can easily conduct MeSH ORA. By utilizing the enriched MeSH terms, related PubMed documents can be retrieved and saved on local machines within this framework.
Background
Due to the rapid development of “-omics” technology, such as DNA microarrays [1] and next-generation sequencing (NGS) [2,3], scientists are now able to quantify large numbers of transcripts from organisms simultaneously. The data output of such high-throughput experiments typically becomes overwhelmingly large, and some statistical analyses must be performed to focus on the genes that are related to the experiment being conducted. For example, p-values indicating significance [4-14], fold changes [15,16], ranks [17,18], factor loadings in principal component analysis [19] and other scores [20] are calculated and considered. Genes of interest can be selected based on these criteria and are listed such as differentially expressed genes (DEGs), single nucleotide polymorphism (SNPs), insertion/deletion (INDEL) mutations, or copy number variations (CNVs), and so on, depending on the experimental paradigm used.
To extract biological meaning from these lists, over-representation analysis (ORA, or enrichment analysis) is widely employed [21,22]. ORA determines which types of biological terms are significantly enriched among the genes on a given list. The degree of enrichment is calculated as a probability that indicates that particular terms are detected in the gene lists more often than expected by chance. The hypergeometric test (or Fisher’s exact test) is widely used to calculate such probabilities. Several thousand statistical tests are conducted against the terms assigned to the list, and only significant terms are extracted. Such terms will help us to gain insight into the biological mechanisms behind the phenomena being investigated. Many annotation resources for ORA have been used, such as Gene Ontology (GO) [23], KEGG [24], Reactome [25], BioCyc [26], BioCarta [27], Disease Ontology [28], and MSigDB [29]. In addition, a wide variety of ORA software has also been developed, including programs such as DAVID/EASEonline [30], FatiGO [31], GOstats [32], topGO, GenMAPP [33], GOMiner [34], GOSurfer [35], FIDEA [36], GOseq [37], EnrichNet [38], OntoTools [39], IPA http://www.ingenuity.com/products/ipa, and BiNGO [40] (comprehensive review of ORA analyses and resources are available in [41-45]).
Recently, Medical Subject Headings (MeSH) [46] terms have also been used for ORA. MeSH is the annotation used for PubMed documents and is manually curated by the U. S. National Library of Medicine (NLM). MeSH has 16 categories and the size of its vocabulary is approximately twice as large as that of GO [47]. MeSH includes biological categories such as “Phenomena and Processes”, “Chemicals and Drugs” and “Anatomy”, as well as the other annotation resources such as GO. MeSH also has a “Diseases” category, which contains many disease-related terms (e.g., “Hypertension” and “Neoplasms”) that facilitate a medical interpretation of data.
Moreover, some MeSH terms are categorized as unique concepts such as “Therapeutic Equipment”, “Anthropology”, “Humanity”, “Psychology”, or even “Information Science”. Therefore, MeSH enables the extraction of broad meaning from the gene lists and is expected to become an exhaustive annotation resource for ORA. In fact, some tools for MeSH ORA are already available, such as Biocompass [47], Gendoo [48], Gene2mesh http://gene2mesh.ncibi.org/, Metab2mesh [49] and Genemesh [50]. However, in certain cases, the implementation of these tools is still not sufficient, for the reasons described below. 1) Few CUI environments
-
With the exception of the application programmable interfaces (API) of gene2mesh and metab2mesh, the available character user interface (CUI) environments are still insufficient. Many bioinformaticians often combine multiple CUI tools and construct an original analytic pipeline on a local machine. Because R developers (notably Bioconductor) provide thousands of R packages to support many types of data analysis and because R is widely used by many “-omics” data analyses, Bioconductor packages are ideal for MeSH ORA. All Bioconductor packages are freely downloadable and accessible for any user. With Bioconductor packages, the output of upstream analyses can be seamlessly input into the function of downstream analysis.
2) Multiplicity of tests
-
As described above, in ORA, several thousand statistical tests are conducted simultaneously. Such an approach is categorized as a multiple testing problem. Existing MeSH ORA software does not account for this multiplicity. Therefore, type 1 errors accumulate, and the significance level (p-value) may cause a high incidence false-positives. Many bioinformatics tools have employed the false discovery rate (FDR) statistic [51] instead of p-value, which is appropriate for MeSH ORA.
3) Time-consuming PubMed searches
-
Many -omics studies focus on the functions of individual genes. To do so, the researcher must retrieve many references from the literature about each gene and investigate the details. This step is very time-consuming, and there is no existing informatics tool to support this step. Because MeSH itself is an annotation of the information contained in PubMed documents, enriched pairs of MeSH terms and Gene IDs can be used to retrieve relevant literature from PubMed based on the co-occurrence of these pairs. No other annotation resouce (such as GO) can perform this step because such terms in other resources correspond only to Gene IDs and not to PubMed IDs. This is the biggest advantage when using MeSH ORA; MeSH terms help users to retrieve relevant literature without manual web browsing. However, the existing MeSH ORA software does not implement such a function.
For these reasons, we designed an original MeSH ORA framework to meet the requirements stated above.
Implementation
Framework and implementation
Our framework consists of six types of R packages: MeSH.db, MeSH.AOR.db, MeSH.PCR.db, the org.MeSH.XXX.db-type packages (where XXX represents the abbreviation for an organism such as “Hsa” for Homo sapiens), MeSHDbi and meshr (Figure 1). These packages are freely available from Bioconductor [52] 2.14 under the Artistic-2.0 public license.

MeSH ORA framework and dependency of the packages. Our MeSH framework consists of six types of R packages: the MeSH.db, MeSH.AOR.db-type packages, MeSH.PCR.db, org.MeSH.XXX.db, MeSHDbi, and meshr. MeSHDbi defines the class used in the MeSH.db, MeSH.AOR.db, MeSH.PCR.db, and org.MeSH.XXX.db-type packages and then unifies the behavior of these packages. meshr imports the data from MeSH.db and org.MeSH.XXX.db and performs ORA.
MeSH.db
MeSH.db outputs general information from MeSH. The MeSH data in the NLM database (http://www.nlm.nih.gov/mesh/filelist.html) are stored internally in MeSH.db. NLM MeSH database is updated annually, and version 1.0.0 of MeSH.db supplies the MeSH data from 2014. MeSH has 16 categories and each category is expressed as a single capital letter, as defined by NLM (Table 1).
MeSH.db also provides qualifier terms, which are broader categories (e.g., pathology, history, and genetics) and synonyms, which are more colloquial words with that have same meanings as the MeSH terms.
MeSH.AOR.db and MeSH.PCR.db
MeSH.AOR.db and MeSH.PCR.db provide information regarding to the MeSH database structure. The MeSH database has a tree structure similar to that of the GO database; i.e., its structure is hierarchical, and the higher-order terms (e.g., cancer) include the lower-order terms (e.g., breast cancer). MeSH.AOR.db and MeSH.PCR.db provide ancestor-offspring relationships (AOR) and parent-child relationships (PCR), respectively.
org.MeSH.XXX.db-type packages
org.MeSH.XXX.db-type packages provide the correspondence between NCBI Entrez Gene IDs and NLM MeSH IDs for each organism. Only the data that have sufficiently high correspondence between the Entrez Gene and MeSH IDs were selected.
First, we focused on the organisms used in at least one of five available genome-wide tools: Affymetrix GeneChip [1], Gene Ontology [23], Bioconductor [52], UCSC Genome Browser [53] and Gendoo [48] (Figure 2). Overall, 168 organisms were selected by this criterion (Figure 3).

Genome-wide tools. We focused on organisms that are used in genome-wide tools such as the UCSC Genome Browser, GeneChip, Gene Ontology, Gendoo, and Bioconductor.

120 orgnisms. To construct org.MeSH.XXX.db-type packages, we focused on organisms satisfying three requirements: 1) use in at least one of five genome-wide tools; 2) possession of an Entrez Gene ID, rather than an Ensembl Gene ID; and 3) published data abailable in at least 100 papers. Finally, 120 organisms were selected for the framework.
Next, we focused on the organisms that had at least 1000 of Entrez Gene IDs. Some organisms have only Ensembl Gene IDs but no Entrez Gene IDs, and because our framework uses only Entrez Gene IDs, such organisms were rejected. After this step, 115 organisms remained.
Finally, we classified the remaining organisms as major or minor. Here we defined major and minor organisms by whether the organisms have at least 100 PubMed IDs. We defined 15 well-annotated organisms as “major organisms”: Arabidopsis thaliana, Bacillus subtilis subsp. spizizenii str. 168, Bos taurus, Caenorhabditis elegans, Drosophila melanogaster, Danio rerio, Escherichia coli str. K-12 substr. MG1655, Gallus gallus, Homo sapiens, Mus musculus, Rattus norvegicus, Saccharomyces cerevisiae S288c, Shizosaccharomyces pombe 972h-, Sus scrofa, and Xenopus laevis. In some cases, thousands of Entrez Gene IDs are assigned in a single publication. Most such papers describe the determination of genome sequences or genome projects/databases rather than specific gene functions. Therefore, we omitted those papers that were assigned more than 1000 Entrez Gene IDs.
Three ways of corresponding the Entrez Gene and MeSH IDs was used in these organisms: Gendoo (http://gendoo.dbcls.jp/data/), gene2pubmed (ftp://ftp.ncbi.nih.gov/gene/DATA/), and RBBH (reciprocal BLAST best hit). Gene2pubmed is used against 15 major and 100 minor organsisms, and RBBH is used against only the 100 minor organisms. Gendoo is used against only 9 organisms included in the Gendoo website (http://gendoo.dbcls.jp/). Figure 4 shows the 120 organisms and their data sources.

Data Sources. The data source of the 120 organisms in our framework. Three data sources - RBBH, gene2pubmed, Gendoo - were choosen.
1) gene2pubmed
-
gene2pubmed provides the correspondence between the Entrez Gene and PubMed IDs assigned by NCBI manual curation. We converted these PubMed IDs to their corresponding MeSH terms using data licenced by PubMed (http://www.nlm.nih.gov/databases/license/license.html), and then converted these MeSH terms to MeSH IDs using the data from the NLM MeSH (Figure 5).
Figure 5 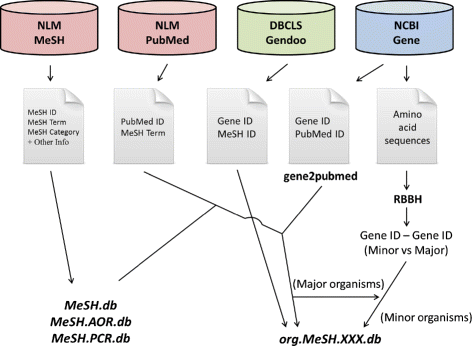
Data retrieval schema for the construction of MeSH.db and org.MeSH.XXX.db . MeSH.db uses the data for MeSH terms from NLM. org.MeSH.XXX.db uses the data from Gendoo, gene2pubmed and RBBH.

2) RBBH
-
Due to the lack of relevant literature, minor organisms were poorly annotated by 1) gene2pubmed approarch. Because many gene and protein annotations are based on sequence similarity against other organisms such as FANTOM project [54,55], GO [23], blast2go [56], InterProScan [57], and RAPSearch [58], we conducted a sequence homology search of these minor organisms against the major organisms and then applied the MeSH IDs of the major organisms to these minor organisms (Figure 6). We performed a reciprocal BLAST [59] best-hit search among all possible combinations of the 15 major organisms and 100 minor organisms (Figure 7). A total of 3000 (100 minor organisms × 15 major organisms × 2-direction) blastp programs were performed (E-values are 50).
Figure 6 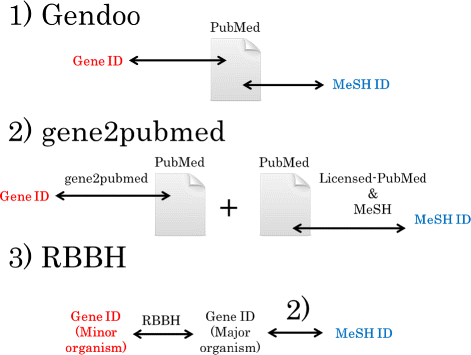
Three types of correspondence between Entrez Gene ID and MeSH ID. org.MeSH.XXX.db-type packages provide three types of correspondence between Entrez Gene ID and MeSH ID: 1) Gendoo data, in which the correspondence is assigned by a text-mining technique; 2) gene2pubmed data, in which the correspondence is assigned by manual curation of NCBI; and 3) RBBH data, in which the correspondence is assigned by using reciprocal BLASTP best hits among all possible combinations of minor organisms and major organisms.
Figure 7 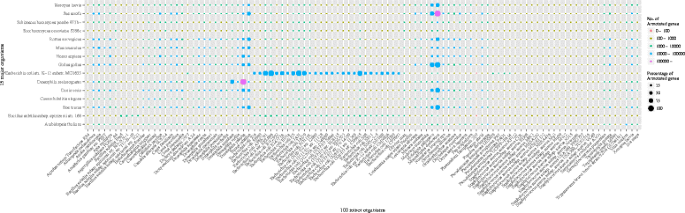
RBBH. A comparison of 100 minor organisms with 15 major organisms by RBBH was conducted.


3) Gendoo
-
The Entrez GeneID - MeSH ID relationship in Gendoo was assigned using a text-mining technique. The degree of relevance between the Entrez Gene and MeSH IDs was assessed by the Kullback-Leibler divergence [60].
A summary of the 120 organisms in each MeSH category is given in Additional file 1.
MeSHDbi
The MeSHDbi package has two roles; class definition and aiding in the construction of custom org.MeSH.XXX.db-type packages by the user. 1) Class definition
-
MeSH.db, MeSH.AOR.db, MeSH.PCR.db and the org.MeSH.XXX.db-type packages follow the classes and methods of S4, which is the R OOP (Object-Oriented Programming) system. The MeSHDbi package defines an S4 class named “MeSHDb” and then unifies the grammar of the functions of these packages. Thus, the behavior of these packages is unified by MeSHDbi such that the user can input the same commands for all packages. This implementation is not only for the users but also for the developers, because it reduces the amount of source code.
The “MeSHDb” class has a “SELECT” function, which is used for data retrieval (Figure 8). The user specifies three optional parameters in SELECT: keys, cols and keytype. This grammar is very similar to that of SQL languages, which have been used for the management of relational databases.
Figure 8 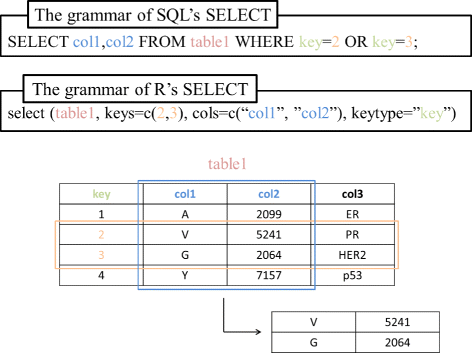
SELECT function in R. AnnotationDbi package declares that data are designed to be retrieved by the SELECT function. Its grammar is similar to that of SQL’s SELECT method and very simple.

2) Custom org.MeSH.XXX.db -type package construction
-
Although we implemented 120 org.MeSH.XXX.db-type packages, more genomes are being sequenced thanks to the rapid spread of NGS technology. Additionally, some users may want to utilize the correspondence between Gene IDs and MeSH IDs designed in other databases, which we currently do not support [47,49,50]. Therefore, we implemented the makeGeneMeSHPackage function, which enables the users to construct an original org.MeSH.XXX.db-type package.
meshr
meshr imports data from MeSH.db and org.MeSH.XXX.db-type packages and then performs MeSH ORA against a gene list of the user’s choice. The hypergeometric test evaluates the types of MeSH terms that are enriched in the gene lists. The p-value is defined by the following equation:
where N is the total number of all genes, k is number of interesting genes (e.g., DEGs), M is the number of genes assigned to a MeSH term and x is the number of interesting genes (e.g., DEGs) assigned to a MeSH term.
In the meshr package, the following three FDR control methods are implemented for multiple testing. 1) Benjamini-Hochberg (BH) method
-
The BH method [51] assumes a uniform distribution of p-values when all null-hypotheses (e.g., non-DEGs) are true. The BH method defines the threshold of the q-value instead of the p-value. The q-value is an expectation value of FDR. The procedures of the BH method is as follows.
-
Set an α threshold, where 0<α<1.
-
Sort the observed p-values in ascending order, such as p 1≤p 2≤..≤p m , where m is the number of hypothesis tests.
-
For each ith p-value, calculate \(q_{i} = \frac {p_{i} \times N}{i}\), where N is the number of p-values.
-
If the kth q-value is less than α, then reject the null-hypotheses corresponding to p 1≤p 2≤...≤p k . Otherwise, reject nothing.
-
2) Q -value and local FDR
-
In contrast to the BH method, the Q-value [61,62] and the local FDR [63,64] methods hypothesize that p-values are from mixture distribution of null-hypotheses and alternative hypotheses (e.g., DEGs), where the mixture ratio is π 0 : 1 - π 0.
In Q-value, π 0 is estimated from a p-value histogram using a natural cubic spline curve [62]. The estimated π 0 is multiplied to q-value in BH method:
$$ Q_{i} = \frac{\pi_{0} \times p_{i} \times N}{i}, $$((2))whereas, local FDR uses a Bayesian approach. π 0 is assumed to be a prior distribution in Bayes’ theorem, and FDR is estimated using the following equation:
$$ LocalFDR = \frac{f_{0}(p) \times \pi_{0}}{f(p)}, $$((3))where, f 0(p) is the null-hypothesis density distribution function and f(p) is the density distribution function of the observed p-values.
These methods are expected to work appropriately even if the p-values are not uniformly distributed. Therefore, the users should first observe the distribution of p-values and then choose the appropriate method.
meshr also retrieves PubMed documents related to enriched MeSH terms, which saves the researcher some of the time that would have been spent searching the related literature. The documents can be saved in PDF or HTML format on a local machine, and a directory can be organized by Gene ID, MeSH ID or PubMed ID. Therefore, a researcher can directly call the publications in which a gene of interest was studied.
Results and discussion
Summary of MeSH assignment to Entrez gene ID
MeSH IDs and Gene IDs are linked from the data sources gendoo, gene2pubmed, and RBBH. Here, we demonstrate how many genes are assigned to MeSH, how much MeSH and existing annotation are duplicated and how many poorly annotated genes are newly annotated by MeSH, for each organism meeting our criteria.
A summary of the MeSH assignment of all genes of 115 organisms is shown in Figure 9 (the Entrez Gene IDs of Synechocystis, Miyakogusa, Mesorhizobium, Anabaena, and Silkworm are not assigned to a specific species). We hypothesized that the genes assigned a name were annotated and the genes assigned only a locus tag were unannotated. Figure 9 (A) shows that the genes assigned a name (red, the average value is 39.61), a MeSH (green, the average value is 10.04), and a locus tag (blue, the average value is 50.34) in this work. Figure 9 (B) shows that the genes assigned gene only (red, the average value is 33.97), a gene name and a MeSH (yellow, the average value is 34.25), and MeSH only (green, the average value is 31.77). In the case of Aspergillus nidulans FGSC A4, most genes were not previously annotated (B, red) but were newly annotated by MeSH in this work (A, green). In contrast, the percentage of genes newly annotated by MeSH was low in some strains of Escherichia coli. It may be because the genes of the wild type strain Escherichia coli K-12 substr. MG1655 are extremely well assigned (approximately 100%) and the gene annotation of the other E. coli strains are based on this wild-type strain. Precise number of the coverage of MeSH in each organisms is summarized in Additional file 2.

Summary of MeSH Assignment to Entrez Gene ID. Detailed coverage of MeSH against all genes of 115 organisms without Synechocystis, Miyakogusa, Mesorhizobium, Anabaena, and Silkworm. We hypothesized that genes assigned to gene name is well-annotated genes and genes assigned to only locus tag is not-annotated genes. (A) The genes assigned to gene name (red), the genes assigned to only locus tag (blue), and the genes newly annotated by MeSH in this work (green). (B) The genes assigned to only gene name (red), the genes annotated by gene name and MeSH (green), and the genes newly annotated by MeSH in this work (blue).
USAGE
We demonstrate the generation of a simple MeSH ORA by using the R script (Figure 10). The download process of our packages will finished in about several minutes (we calculated the time using an iMac, 8GB RAM, 64bit, Intel Core i7, and Mac OS X v-10.10 Yosemite). To perform MeSH ORA, the meshr package is loaded on the 1st line. The fdrtool package, which is used for the FDR adjustment, is loaded on the 2nd line. On the 3rd line, the correspondence between the Entrez Gene IDs and MeSH IDs is loaded. On the 4th and 5th lines, all Entrez Gene IDs and interesting Gene IDs are loaded. All Entrez Gene IDs are assumed to be retrieved from org.MeSH.XXX.db-type packages. Interesting Gene IDs are assumed to be generated by some omics-analyses. At present, meshr accepts only Entrez Gene IDs as input. Therefore, if a user starts with Ensembl Gene ID, Affymetrix probe ID, or another identifier, he or she has to convert these IDs to Entrez Gene IDs. Such a task can be easily performed by a pre-existing annotation packages (e.g., Homo.sapiens, Mus.musculus, Rattus.norvegicus, and biomaRt [65,66] packages). These packages will convert IDs from ID lists such as Ensembl Gene ID, RefSeq ID, Locus Tag, or gene name. The NCBI FTP site (ftp://ftp.ncbi.nih.gov/gene//DATA/) also provides some useful files, which may help to retrieve Entrez Gene IDs from different forms of ID.

Simple R code for MeSH ORA. MeSH ORA for Homo sapiens can be performed by a simple R code.
-
RefSeq ID to Entrez Gene ID : gene2refseq
-
Taxonomy ID to Entrez Gene ID : gene2accession
-
Locus tag to Entrez Gene ID : gene2accession
-
Gene name to Entrez Gene ID : gene2accession
-
Ensembl Gene ID to Entrez Gene ID : gene2ensembl
-
GO ID to Entrez Gene ID : gene2go
-
PubMed ID to Entrez Gene ID : gene2pubmed
-
UniGene ID to Entrez Gene ID : gene2unigene
-
STS ID to Entrez Gene ID : gene2sts
Each of the 120 organisms can be loaded in the same way, and the same analysis can be performed. The parameters for the MeSH ORA are defined on the 6th line. This procedure is the same as that used by other ORA packages such as GOstats [32]. Here, MeSH “D” (Chemicals and Drugs) category from the Gendoo dataset is set using a 0.05 threshold for QV (Q-value method) FDR adjustment. The function meshHyperGTest performes the MeSH ORA against the prepared parameters. The result is summarized in a table from which the user can retrieve additional information such as significant MeSH terms or corresponding Entrez Gene IDs.
We can also retrieve the documents of related studies seamlessly by using the save.pdf and save.abst functions. By these functions, PDF files can be downloaded onto a local machine, which saves the time spent on a PubMed search, allowing the researchers to spend more time on downstream data analysis involving biological interpretation (an abstract retrieval function will also be implemented by Bioconductor 3.1). The meshr package provides two types of documentation: manual pages to explain all functions and optional parameters and a vignette containing the R source-code, description, and figures. The user can refer to these documents and conduct further sophisticated analyses by combining this package with other Bioconductor packages.
Case-study
Here, we demonstrate the usability of our framework by re-analyzing past genome-wide studies. We used a DNA-microarray dataset for a calorie-restricted rat as a representative study of a major organism and the NGS dataset of Pseudomonas aeruginosa - a known drug-resistant bacterium - as a minor organism.
Case-study 1: Rattus norvegicus (Rat) as a major organism
Caloric restriction (CR) has been suggested to be associated with longevity. Chujo et al. found that life-long CR is related to the remodeling of white adipose tissue (WAT) by analyzing the gene expression of rats under CR conditions [67].
The author used 4 CR rats and 4 control rats and compared them by Affymetrix Rat Genome 230 2.0 Array (GEO Accession: GSE30668). DEGs were detected by two-way ANOVA (p < 0.001) using superNORM [68] normalization, principal component analysis and further evaluation by quantitative real-time RT-PCR. They used the GO (Biological Process) database to annotate 199 upregulated DEGs and 226 downregulated DEGs. 36 GO terms showed that the DEGs were involved in “lipid biosynthesis” or “inflammation”.
We re-analyzed the same data using by the t-test with the FDR method (Q-value) and detected 505 DEGs (Q < 0.2, see Additional file 3). We conducted ORA with these gene lists (Figure 11). 15 of the 36 previously identified GO terms were detected again (the red words in the tagcloud of Biological Process in Figure 11).

ORA with calorie-restricted rats. Enrichment analysis using Gendoo, gene2pubmed and GO. A (Anatomy), B (Organisms), C (Diseases), D (Chemicals and Drugs), G (Phenomena and Processes) of Gendoo, A, C, D, E (Analytical Diagnostic and Therapeutic Techniques and Equipment), I (Anthropology, Education, Sociology and Social Phenomena) of gene2pubmed, and BP (Biological Process), MF (Molecular Function), CC (Cellular Component) of GO. Only enriched terms are drawn by the tagcloud package (p < 0.05). The minus logarithm of p-values is used as weight and emphasized as the font size.
Well-known CR-related terms such as “Diabetes Mellitus, Experimental” (C of Gendoo and gene2pubmed, E of gene2pubmed), “Carbohydrate Metabolism” (G, Gendoo), “Cell Aging” (G, Gendoo), and “Blood Glucose” and “Insulin” (D, gene2pubmed) are detected. As reported by Chujo et al., mitochondrial biogenesis is also enhanced by CR. For example, in A and D (Gendoo), and CC (Gene Ontology), “Submitochondrial Particles”, “Mitochondria, Muscle”, “Mitochondria, Heart”, “Mitochondrial matrix”, “Mitochondrion”, “Mitochondrial pyruvate dehydrogenase”, and “Mitochondrial part” are actually enriched.
Moreover, by using ORA within a MeSH framework, we can retrieve additional information, including immune-related terms such as “Immunological Synapses” and disease names such as “Meningitis, Meningococcal”, “Spinal Neoplasms” (C, Gendoo), and health-related scientific terms such as “Physical Education and Training”. These terms are expected to help researchers to consider other hypotheses that cannot be constructed using only GO.
Case-study 2: Pseudomonas aeruginosa as a minor organism
Pseudomonas aeruginosa, a clinically important bacterium, is known for its innate antibiotic resistance. Gallagher et al. developed the Tn-seq methodology based on NGS and the amplification of single-strand circles carrying transposon junction sequences that contribute to drug resistance [69]. The authors focused on 28 genes identified by Tn-seq as exhibiting strong mutant hypersensitivity to tobramycin.
They annotated these genes by gene description (NCBI). Known mutations related to drug resistance occurred in some genes, including those encoding the MexXY-OprM efflux pump (ABC-transporter) and a potassium uptake transporter.
Due to the usage of MeSH, the amount of annotation was considerably increased. Tables 2, 3 and 4 show a partial list of the results, and Additional file 3 contains the complete data for this analysis. Corresponding terms such as “Cell membrane” (BP of GO, A of MeSH), “ATP-binding cassette (ABC) transporter complex” (CC of GO, D of MeSH), and “Pseudomonas aeruginosa” were assigned by our framework and GO (Tables 2, 3 and 4). Furthermore, MeSH returned other bacterial names (e.g., Escherichia coli, Salmonella phimurium, and Bacillus subtilis), the names of biological experiments (“Gene Knockout”, “Cloning” and “Transfection”), some clinical descriptions (“Drug Resistance, Microbial” and “Biofilm”) and even the field of study (“Systems Biology” and “Computer Simulation”). Such terms are unique and only MeSH can be used for the their annotation because GO only provides a molecular biological vocabulary.
Conclusions
As shown in the case-studies described above, our framework can be a powerful tool for genome-wide studies. Due to the large number of categories included in MeSH, different interpretations are possible without a restriction to molecular biological terms. The MeSH ORA framework detects enriched MeSH terms from gene lists. Such results can seamlessly be converted into related PubMed documents. This function may support those researchers who spend much time searching through related literature, allowing them to concentrate on the biological interpretation involeved in the downstream steps.
We will also implement GSEA (gene set enrichment analysis) [70], SEA (simpler enrichment analysis) [71], or GSA (gene-set analysis) [72] functions using MeSH. In addition, the plot function will be implemented to visualize the results as a tagcloud, tree, or network mapped from enriched MeSH terms. All data will be semi-annually updated in every Bioconductor version. The data from MeSH and PubMed will be annually downloaded and the analysis of RBBH will also be performed regularly.
All R scripts used in this paper are provided in as Additional file 4.
Availability and requirements
-
Project name: MeSH ORA Framework
-
URLs:
-
http://www.bioconductor.org/packages/release/data/annotation/html/MeSH.db.html
-
http://www.bioconductor.org/packages/release/data/annotation/html/MeSH.AOR.db.html
-
http://www.bioconductor.org/packages/release/data/annotation/html/MeSH.PCR.db.html
-
http://www.bioconductor.org/packages/release/data/annotation/html/org.MeSH.Hsa.db.html
-
http://bioconductor.org/packages/release/bioc/html/meshr.html
-
http://bioconductor.org/packages/release/bioc/html/MeSHDbi.html
-
-
Operating system: Platform independent
-
Programming language: R v 3.1.0 or higher
-
Other requirements: Bioconductor 2.14 or higher (save.abst function will be released by Bioconductor 3.1). Please also note that org.MeSH.XXX.db-type packages are renamed as MeSH.XXX.eg.db-type packages by Bioconductor 3.1.
-
License: Artistic-2.0
-
Any restrictions to use by non-academics: For non-profit use only
References
Irizarry RA, Bolstad BM, Collin F, Cope LM, Hobbs B, Speed TP. Summaries of affymetrix genechip probe level data. Nucleic Acid Res. 2003; 31:e15.
Mardis ER. The impact of next-generation sequencing technology on genetics. Trends Genet. 2008; 24:134–41.
Marioni JC, Mason CE, Mane SM, Stephens M, Gilad Y. Rna-seq: an assessment of technical reproducibility and comparison with gene expression arrays. Genome Res. 2008; 18(9):1509–17.
Wang L, Feng Z, Wang X, Wang X, Zhang X. Degseq: an r package for identifying differentially expressed genes from rna-seq data. BMC Bioinformatics. 2009; 26(1):136–8.
Tarazona S, García-Alcalde F, Dopazo J, Ferrer A, Conesa A. Differential expression in rna-seq: a matter of depth. Genome Res. 2003; 21(12):2213–23.
Bourgon R, Gentleman R, Huber W. Independent filtering increases detection power for high-throughput experiments. PNAS. 2010; 107(21):9546–51.
Tsai FJ, Yang CF, Chen CC, Chuang LM, Lu CH, Chang CT, et al. A genome-wide association study identifies susceptibility variants for type 2 diabetes in han chinese. PLOS Genet. 2010; 6(2):e1000847.
Li M, Atmaca-Sonmez P, Othman M, Branham KEH, Khanna R, Wade MS, et al. Cfh haplotypes without the y402h coding variant show strong association with susceptibility to age-related macular degeneration. Nat Genet. 2008; 38(9):1049–54.
Marioni JC, Mason CE, Mane SM, Stephens M, Gilad Y. Rna-seq: An assessment of technical reproducibility and comparison with gene expression arrays. Genome Res. 2008; 18:1509–17.
Auer PL, Doerge RW. A two-stage poisson model for testing rna-seq data. Stat Appl Genet Mol Biol. 2011; 10(1):1–26.
Anders S, Huber W. Differential expression analysis for sequence count data. Genome Biol. 2010; 11:106.
Robinson MD, McCarthy DJ, Smyth GK. edger: a bioconductor package for differential expression analysis of digital gene expression data. Bioinformatics. 2010; 26(1):139–40.
Hardcastle TJ, Kelly KA. bayseq: Empirical bayesian methods for identifying differential expression in sequence count data. BMC Bioinformatics. 2010; 11:422.
Zhou Y-H, Xia K, Wright FA. A powerful and flexible approach to the analysis of rna sequence count data. Bioinformatics. 2011; 27(19):2672–8.
McCarthy DJ, Smyth GK. Testing significance relative to a fold-change threshold is a treat. Bioinformatics. 2009; 25(6):765–71.
Feng J, Meyer CA, Wang Q, Liu JS, Shirley LX, Zhang Y. Gfold: a generalized fold change for ranking differentially expressed genes from rna-seq data. Bioinformatics. 2012; 28(21):2782–8.
Troyanskaya OG, Garber ME, Brown PO, Botstein D, Altman RB. Nonparametric methods for identifying differentially expressed genes in microarray data. Bioinformatics. 2002; 18:1454–61.
Breitling R, Armengaud P, Amtmann A, Herzyk P. Rank products: a simple, yet powerful, new method to detect differentially regulated genes in replicated microarray experiments. FEBS Lett. 2004; 573:83–92.
Yamamoto H, Fujimori T, Sato H, Ishikawa G, Kami K, Ohashi Y. Statistical hypothesis testing of factor loading in principal component analysis and its application to metabolite set enrichment analysis. BMC Bioinformatics. 2014;15(51).
Tusher VG, Tibshirani R, Chu G. Significance analysis of microarrays applied to the ionizing radiation response. PNAS. 2001; 98:5116–21.
Huang W, Sherman BT, Lempicki RA. Bioinformatics enrichment tools: paths toward the comprehensive functional analysis of large gene lists. Nucleic Acids Res. 2009; 37(1):1–13.
Khatri P, Sirota M, Butte AJ. Ten years of pathway analysis: Current approaches and outstanding challenges. PLOS Comput. Biol.2012;8(2).
Consortium TGO. Gene ontology: tool for the unification of biology. Nat Genet. 2000; 25:25–9.
Kanehisa M, Goto S. Kegg: Kyoto encyclopedia of genes and genomes. Nucleic Acids Res. 2000; 28:27–30.
Matthews L, Gopinath G, Gillespie M, Caudy M, Croft D, de Bono B, et al. Reactome knowledgebase of biological pathways and processes. Nucleic Acids Res. 2008; 37:619–22.
Caspi R, Altman T, Dale JM, Dreher K, Fulcher CA, Gilham F, et al. The metacyc database of metabolic pathways and enzymes and the biocyc collection of pathway/genome databases. Nucleic Acids Res. 2010; 38:473–9.
Nishimura D. Biocarta. Biotech Softw Internet Rep. 2001; 2:117–20.
Schriml LM, Arze C, Nadendla S, Chang YW, Mazaitis M, Felix V, et al. Disease ontology: a backbone for disease semantic integration. Nucleic Acids Res. 2012; 40(D1):940–6.
Liberzon A, Subramanian A, Pinchback R, Thorvaldsdottir H, Tamayo P, Mesirov JP. Molecular signatures database (msigdb) 3.0. Bioinformatics. 2011; 27(12):1739–40.
Hosack DA, Dennis GJ, Sherman BT, Lane HC, Lempicki PA. Identifying biological themes within lists of genes with ease. Genome Biol. 2003; 4:70.
Shahrour A, Diaz-Uriarte R, Dopazo J. Fatigo: a web tool for finding significant associations of gene ontology terms with groups of genes. Bioinformatics. 2004; 20:578–80.
Falcon S, Gentleman R. Using gostats to test gene lists for go term association. Bioinformatics. 2007; 23(2):257–8.
Dahlquist KD, Salomonis N, Vranizan K, Lawlor SC, Conklin BR. Genmapp, a new tool for viewing and analyzing microarray data on biological pathways. Nat Genet. 2002; 31:19–20.
Zeeberg BR, Feng W, Wang G, Wang MD, Fojo AT, Sunshine M, et al. Gominer: a resource for bilogical interpretation of genomic and proteomic data. Genome Biol. 2003; 4:28.
Zhong S, Storch KF, Lipan O, Kao MC, Weitz CJ, Wong WH. Gosurfer: a graphical interactive tool for comparative analysis of large gene sets in gene ontology space. Appl Bioinformatics. 2004; 3(4):261–4.
DAndrea D, Grassi L, Mazzapioda M, Tramontano A. Fidea: a server for the functional interpretation of differential expression analysis. Nucleic Acids Res. 2013; 41:84–8.
Young MD, Wakefield MJ, Smyth GK, Oshlack A. Gene ontology analysis for rna-seq: accounting for selection bias. Genome Biol. 2010; 11(2):R14.
Glaab E, Baudot A, Krasnogor N, Schneider R, Valencia A. Enrichnet: network-based gene set enrichment analysis. Bioinformatics. 2012; 28(18):451–7.
Draghici S, Khatri P, Bhavsar P, Shah A, Krawetz SA, A TM. Onto-tools, the toolkit of the modern biologist: Onto-express, onto-compare, onto-design, and onto-translate. Nucleic Acids Res. 2003; 31:3775–81.
Maere S, Heymans K, Kuiper M. Bingo: a cytoscape plugin to assess overrepresentation of gene ontology categories in biological networks. Bioinformatics. 2005; 21:3448–9.
Huang W, Sherman BT, Lempicki RA. Bioinformatics enrichment tools: paths toward the comprehensive functional analysis of large gene lists. Nucleic Acids Res. 2009; 37(1):1–13.
Khatri P, Sirota M, Butte AJ. Ten years of pathway analysis: Current approaches and outstanding challenges. PLoS Comput. Biol. 2012; 8(2):e1002375.
Glass K, Girvan M. Annotation enrichment analysis: An altenative method for evluating the functional propertives of gene sets. Sci Rep.2014;4(4191).
Subramanian A, Tamayo P, Mootha V. K, Mukherjee S, Ebert B. L, Gillette M. A, et al. Gene set enrichment analysis: A knowledge-based approach for interpreting genome-wide expression profiles. PNAS. 2005; 102(43):15545–50.
Tipney H, Hunter L. An introduction to effective use of enrichment analysis software. Hum Genomics. 2010; 4(3):202–6.
Nelson SJ, Schopen M, Savage AG, Schulman JL, Arluk N. The mesh translation maintenance system: structure, interface design, and implementation. Stud Health Technol Inform. 2004; 107:67–9.
Nakazato T, Takinaka T, Mizuguchi H, Matsuda H, Bono H, Asogawa M. Biocompass: a novel functional inferance tool that utilizes mesh hierarchy to analyze groups of genes. In Silico Biol. 2007; 8:53–61.
Nakazato T, Bono H, Matsuda H, Takagi T. Gendoo: functional profiling of gene and disease features using mesh vocabulary. Nucleic Acids Res. 2009; 37:166–9.
Sartor MA, Ade A, Wright Z, States D, Omenn GS, Athey B, et al. Metab2mesh: annotating compounds with medical subject headings. Bioinformatics. 2012; 28:1408–10.
Jani SD, Argraves GL, Barth JL, Argraves WS. Genemesh: a web-based microarray analysis tool for relating differentially expressed genes to mesh terms. BMC Bioinformatics. 2010;11(166).
Benjamini Y, Hochberg Y. Controlling the false discovery rate: a practical and powerful approarch to multiple testing. J R Stat Soc B. 1995; 57:289–300.
Gentleman RC, Carey VJ, Bates DM, Bolstad B, Dettling M, Dudoit S, et al. Bioconductor: open software development for computational biology and bioformatics. BMC Genome Biol. 2004; 5(10):R80.
Meyer LR, Zweig AS, Hinrichs AS, Karolchik D, Kuhn RM, Wong M, et al. The ucsc genome browser database: extensions and updates 2013. Nucleic Acids Res. 2012; 41:64–69.
Kawai J, Shinagawa A, Shibata K, Yoshino M, Itoh M, Ishii Y, et al. Functional annotation of a full-length mouse cdna collection. Nature. 2001; 409(6821):685–690.
Okazaki Y, Furuno M, Kasukawa T, Adachi J, Bono H, Kondo S, et al. Analysis of the mouse transcriptome based on functional annotation of 60,770 full-length cdnas. Nature. 2002; 420(6915):563–573.
Conesa A, Gotz S, Garcia-Gomez J. M, Terol J, Talon M, Robles M. Blast2go: a universal tool for annotation, visualization and analysis in functional genomics research. Bioinformatics. 2005; 21(18):3674–76.
Jones P, Binns D, Chang H, Fraser M, Li W, McAnulla C, et al. Interproscan 5: genome-scale protein function classification. Bioinformatics. 2014; 30(9):1236–40.
Ye Y, Choi J, Tang H. Rapsearch: a fast protein similarity search tool for short reads. BMC Bioinformatics. 2011;12(159).
Altschul SF, Gish W, Miller W, Myers EW, Lipman DJ. Basic local alignment search tool. J Mol Biol. 1990; 215(3):403–10.
Quinlan JR. C4.5: Programs for machine learning. Burlington, Massachusetts, US: Morgan Kaufmann Publishers Inc.; 1993.
Storey JD. The positive false discovery rate: A bayesian interpretation and the q-value. Ann Stat. 2003; 31:2013–35.
Storey JD, Tibshirani R. Statistical significance for genomewide studies. PNAS. 2003; 100:9440–5.
Efron B, Tibshirani R, Storey JD, Tusher V. Empirical bayes analysis of a microarray experiment. J Am Stat Assoc. 2001; 96:1151–60.
Efron B, Tibshirani R. Empirical bayes methods and false discovery rates for microarrays. Genetic Epidemiol. 2002; 23:70–86.
Durinck S, Spellman PT, Birney E, Huber W. Mapping identifiers for the integration of genomic datasets with the r/bioconductor package biomart. Nat Protocols. 2009; 4:1184–91.
Durinck S, Moreau Y, Kasprzyk A, Davis S, Moor BD, Brazma A, et al. Biomart and bioconductor: a powerful link between biological databases and microarray data analysis. Bioinformatics. 2005; 21:3439–40.
Chujo Y, Fujii N, Okita N, Konishi T, Narita T, Yamada A, et al. Caloric restriction-associated remodeling of rat white adipose tissue: effects on the growth hormone/insulin-like growth factor-1 axis, sterol regulatory element binding protein-1, and macrophage infiltration. Age (Dordr). 2013; 35(4):1143–1156.
Konishi T. Three-parameter lognormal distribution uniquitosusly found in cdna microarray data and its application to parametric data treatment. BMC Bioinformatics. 2004;5.
Gallagher LA, Shendure J, Manoil C. Genome-scale identification of resistance functions in pseudomonas aeruginosa using tn-seq. mBio. 2011; 2:00315–10.
Aravind S, Pablo T, Vamsi KM, Sayan M, Benjamin LE, Michael AG, et al. A knowledge-based approach for interpreting genome-wide expression profiles. PNAS. 2005; 102(43):10.
Irizarry RA, Wang C, Zhou Y, Speed TP. Gene set enrichment analysis made simple. Stat Methods Med Res. 2009; 18(6):565–75.
Efron B, Tibshirani R. On testing the significance of sets of genes. Annu Appl Stat. 2007; 1(1):107–129.
Acknowledgements
We acknowledge PubMed and MeSH, particularly Kilbourne John who is head of the MeSH section in NLM. We also thank Margaret McGhee and Veronica Robinson Garrett for providing the licensed PubMed data. Some of the calculations were performed using the RIKEN Integrated Combined Cluster (RICC) and supercomputer system at the National Institute of Genetics (NIG) and Research Organization of Information and Systems (ROIS).
Author information
Authors and Affiliations
Corresponding authors
Additional information
Competing interests
The authors declare that they have no competing interests.
Authors’ contributions
KT, GM and IN designed and configured the various approaches used in this study. KT implemented the MeSH.db, MeSH.AOR.db, MeSH.PCR.db, and part of the org.MeSH.XXX.db-type packages. GM implemented meshr. IN implemented the org.MeSH.XXX.db-type packages. MI was engaged in the retrieval of data and maintenance of all packages. NT developed Gendoo. GM, KT and IN prepared the figures and wrote the manuscript. All authors read and approved the final manuscript.
Additional files
Additional file 1
Summary of all organisms in each MeSH category.
Additional file 2
Precise coverage of MeSH against all genes of 115 organisms.
Additional file 4
All R scripts and packages used in this paper.
Rights and permissions
This is an Open Access article distributed under the terms of the Creative Commons Attribution License (http://creativecommons.org/licenses/by/4.0), which permits unrestricted use, distribution, and reproduction in any medium, provided the original work is properly credited. The Creative Commons Public Domain Dedication waiver (http://creativecommons.org/publicdomain/zero/1.0/) applies to the data made available in this article, unless otherwise stated.
About this article

Cite this article
Tsuyuzaki, K., Morota, G., Ishii, M. et al. MeSH ORA framework: R/Bioconductor packages to support MeSH over-representation analysis. BMC Bioinformatics 16, 45 (2015). https://doi.org/10.1186/s12859-015-0453-z
Received:
Accepted:
Published:
DOI: https://doi.org/10.1186/s12859-015-0453-z