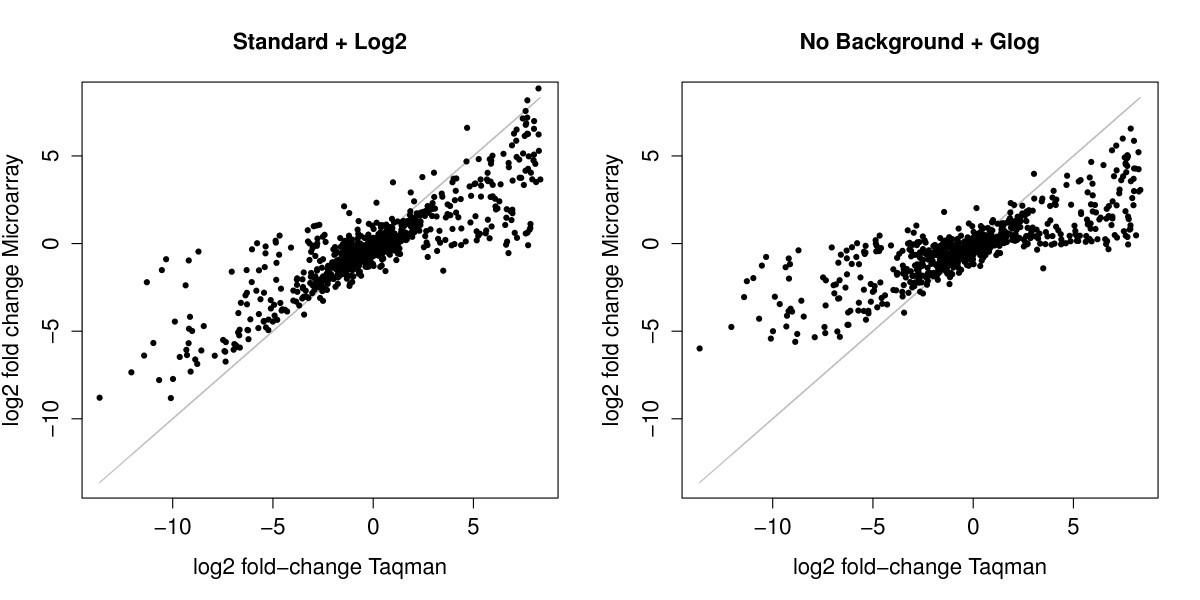
Figure 1

Scatter plot between microarray and Taqman. Scatter plot of log2 fold-changes obtained from quantitative PCR versus the log2 fold-changes obtained from microarray after the best- (Standard background correction with log2 transformation) and the worst- (No background correction with glog transformation) preprocessing methods. Microarray data leads to fold-change compressions for many genes, especially with the No background correction and the glog transformation (see Figure2).