Figure 4
From: WGCNA: an R package for weighted correlation network analysis
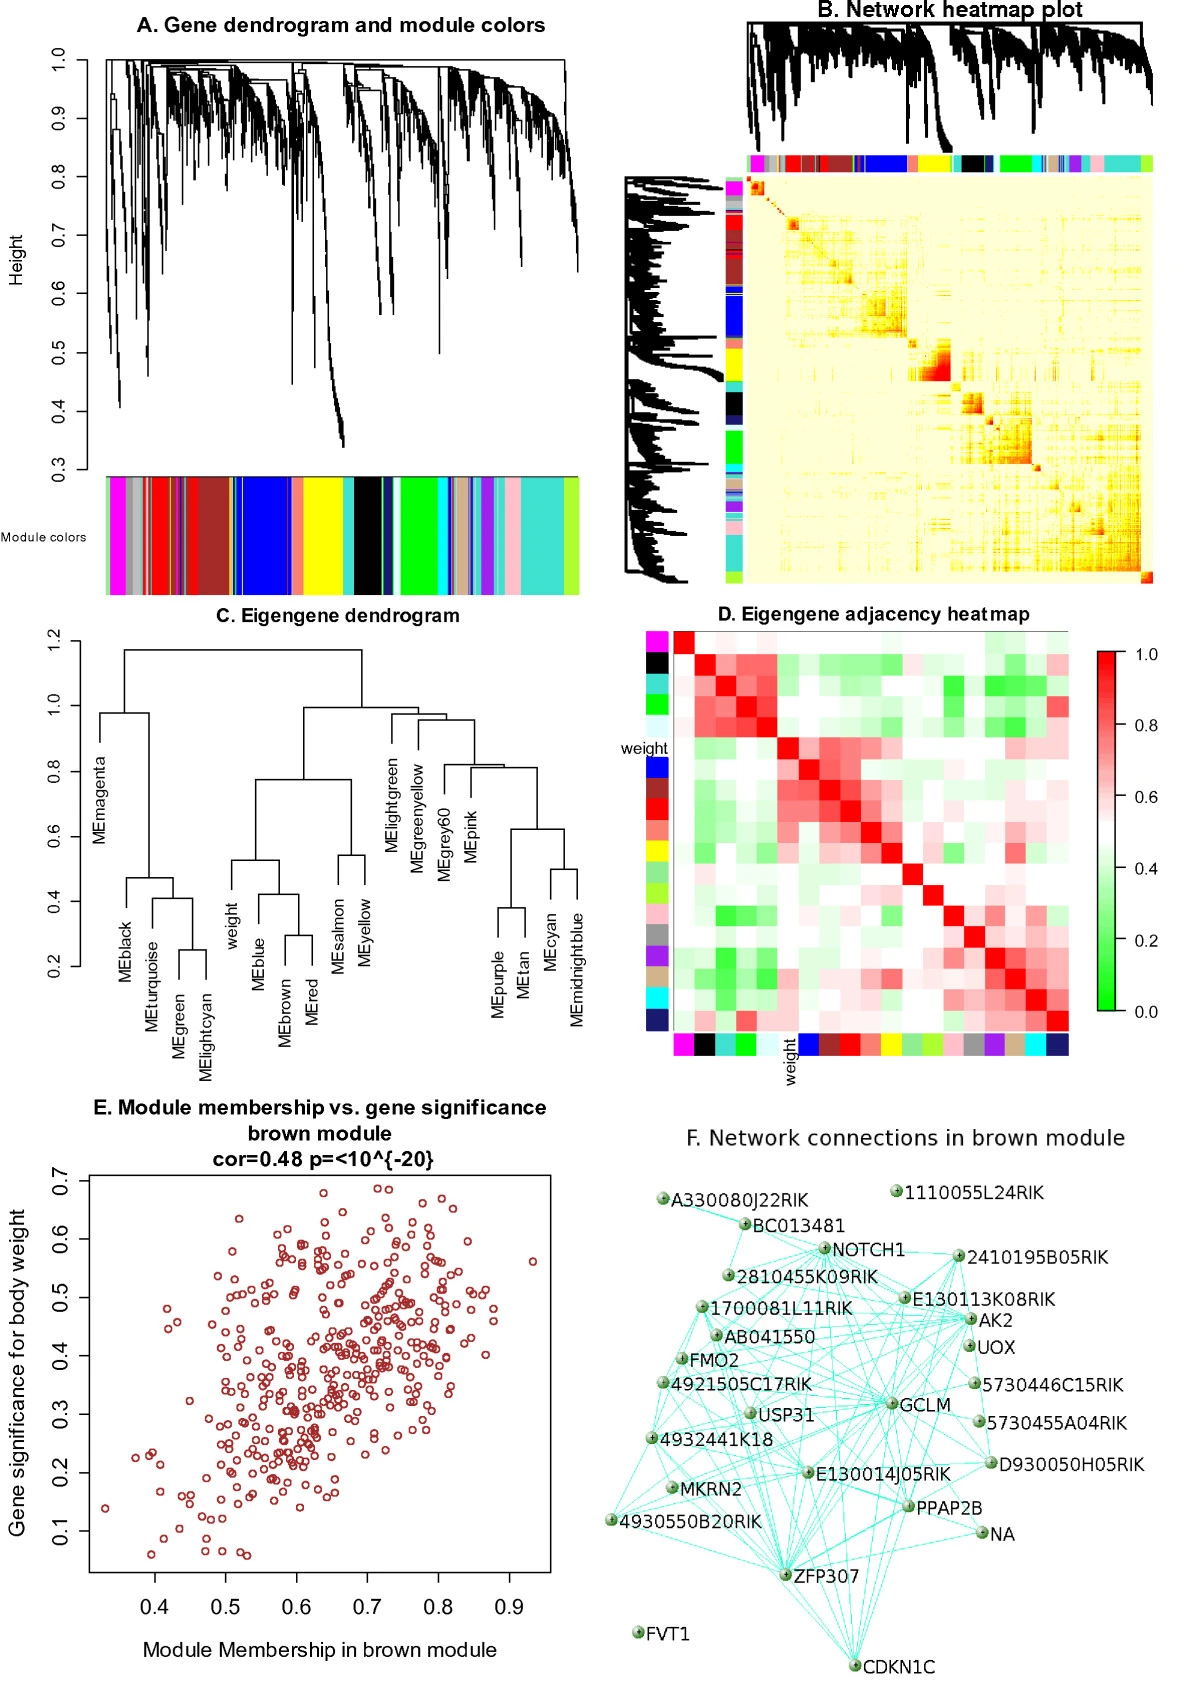
Example WGCNA analysis of liver expression data in female mice. A. Gene dendrogram obtained by average linkage hierarchical clustering. The color row underneath the dendrogram shows the module assignment determined by the Dynamic Tree Cut. B. Heatmap plot of topological overlap in the gene network. In the heatmap, each row and column corresponds to a gene, light color denotes low topological overlap, and progressively darker red denotes higher topological overlap. Darker squares along the diagonal correspond to modules. The gene dendrogram and module assignment are shown along the left and top. C. Hierarchical clustering of module eigengenes that summarize the modules found in the clustering analysis. Branches of the dendrogram (the meta-modules) group together eigengenes that are positively correlated. D. Heatmap plot of the adjacencies in the eigengene network including the trait weight. Each row and column in the heatmap corresponds to one module eigengene (labeled by color) or weight. In the heatmap, green color represents low adjacency (negative correlation), while red represents high adjacency (positive correlation). Squares of red color along the diagonal are the meta-modules. E. A scatterplot of gene significance for weight (GS, Equation 2) versus module membership (MM, Equation 6) in the brown module. GS and MM exhibit a very significant correlation, implying that hub genes of the brown module also tend to be highly correlated with weight. F. The network of the 30 most highly connected genes in the brown module. In this network we only display a connection of the corresponding topological overlap is above a threshold of 0.08.