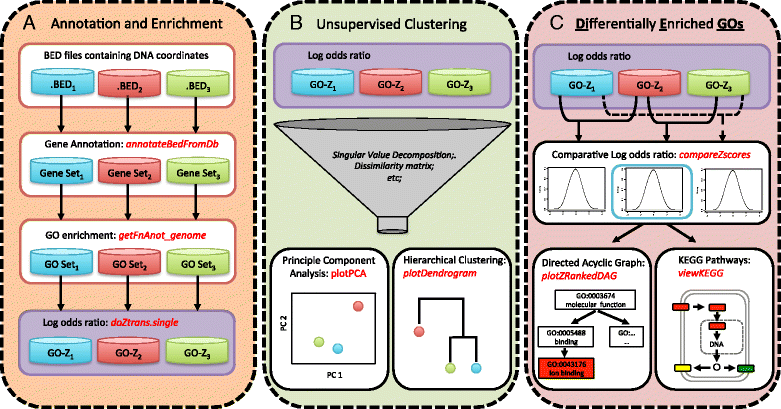
Fig. 1

Overview of the CompGO pipeline and implemented functions. a The “annotateBedFromDb” function annotates DNA coordinates from BED files against transcript coordinates from a reference genome, “getFnAnot_genome” queries gene lists using the RDAVIDWebService and returns statistics and counts of each GO term and “doZtrans.single” calculates the log odds ratio of GO term enrichment. Note: users can supply their own background genome regions; by default the whole genome is used. b Given log odds ratios, multiple experiments can be reduced into a single matrix for Principle Component Analysis or Hierarchical Clustering, via “plotPCA” and “plotDendrogram” respectively. c Differentially Enriched GOs (DiEGOs) between pairs of experiments are calculated via the differential log odds ratio and top DiEGOs can be visualized via Directed Acyclic Graphs, “plotZRankedDAG”, and top differentially enriched pathways via “viewKEGG”. CompGO functions are colored red