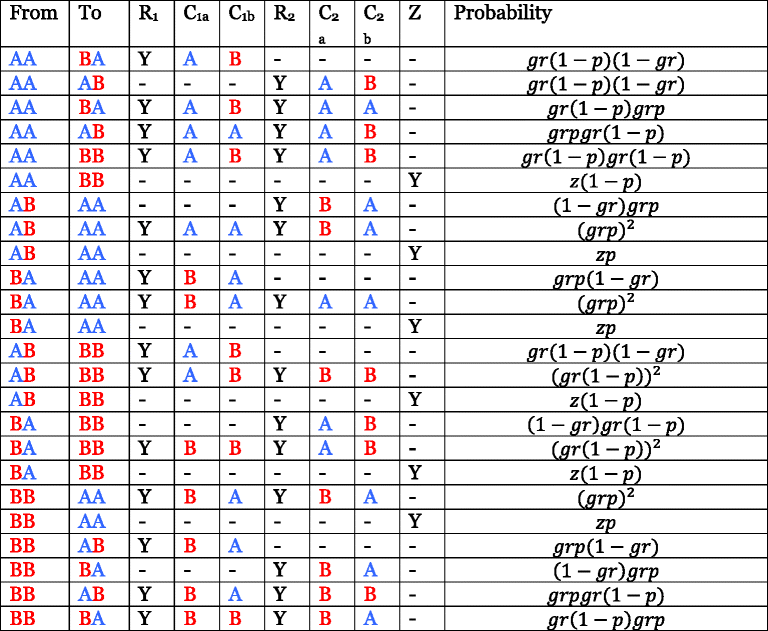
- “A” and “B” denote chromosomes derived from ancestral populations A and B, and the three states AA, AB, and BB model regions where ancestry is homozygous from population A, heterozygous, and homozygous from population B, respectively (AB and BA are represented by same state, but are shown separately here to clarify that the ancestry of both separate chromosomes must be considered when computing probabilities). The other columns denote possible recombination-related events on the two parental homologues of a given chromosome (henceforth “homologue 1” and “homologue 2”). A “Y” in the R1 column signifies that recombination took place at a given base on chromosome homologue 1 in the time since admixture, and a “Y” in the R2 column signifies that recombination took place at this base on chromosome homologue 2. C1a and C1b refer to the ancestry of the bases on chromosome homologue 1 immediately before and after the recombination event, if it happened; C2a and C2b refer to the ancestry of the bases on chromosome homologue 2 before and after recombination. Z indicates that the same ancestral recombination event, which happened in the time since admixture, was sampled twice in the same individual (once on chromosome homologue 1 and once on chromosome homologue 2). The parameter g is the number of generations since admixture, r is the recombination probability per site per generation, assumed to be 1 cM/Mb or 10–8 per site, and z is the probability of resampling the same ancestral recombination event twice in one individual, according to genetic drift approximated by the Wright-Fisher model
