Fig. 2
From: BPG: Seamless, automated and interactive visualization of scientific data
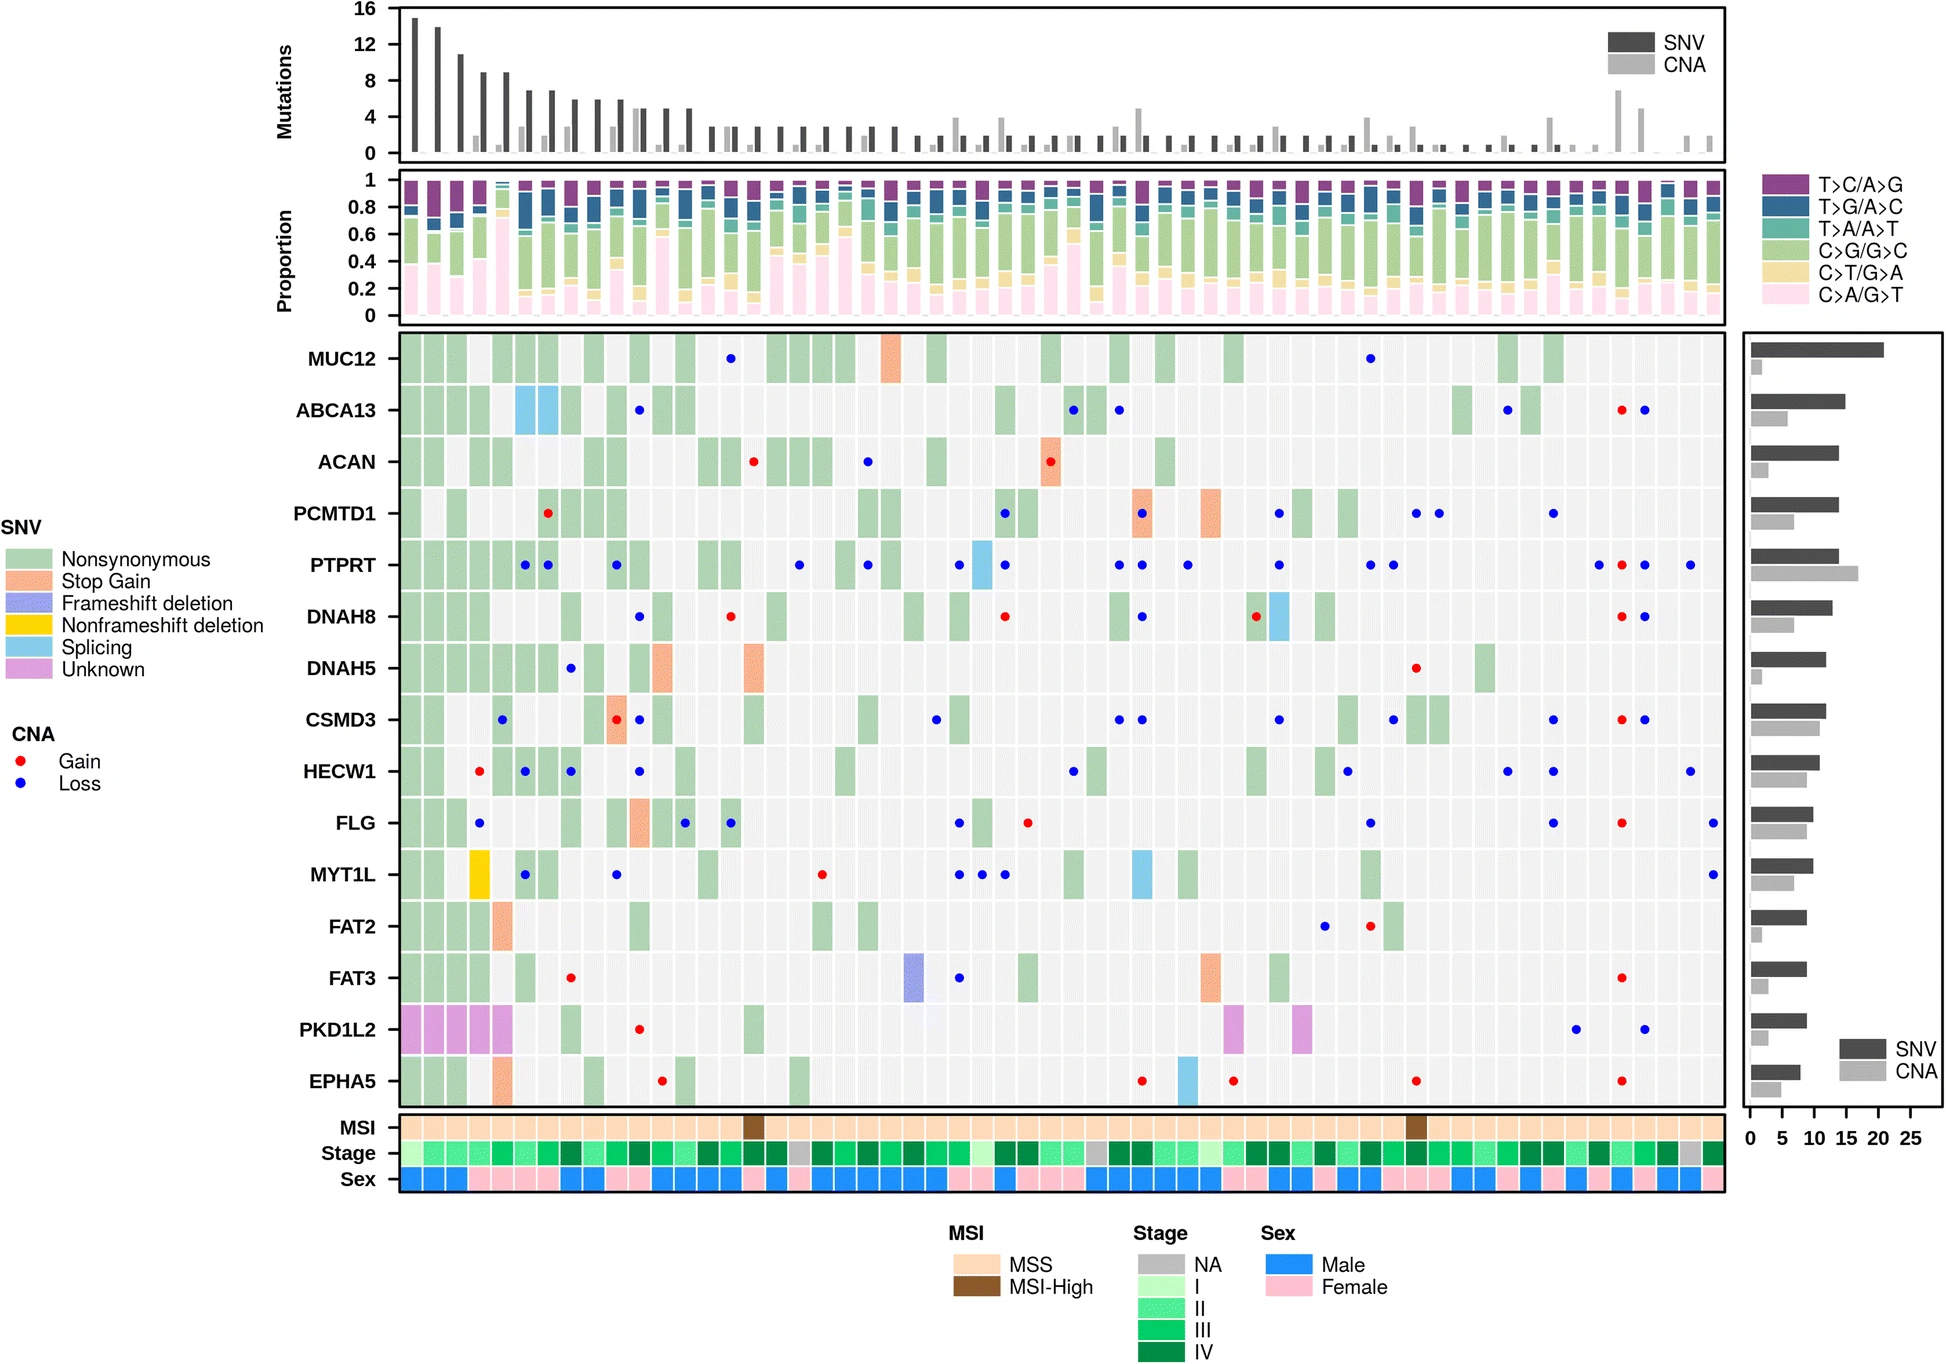
Multiplot example. The create.multiplot function is able to join multiple chart-types together into a single figure. In this example, a central dotmap conveys the somatic mutations present in a selection of genes (y-axis) for a number of colorectal tumours (x-axis), while adjacent barplots and heatmaps provide additional information. Within this central dotmap, shaded cells reflect single nucleotide variants (SNVs), while dots in cells reflect copy number aberration (CNAs), which some patients have both types of aberration in a single gene (shaded cells harbouring a dot). The colour of the cell or dot indicates the specific type of mutation, using the legend on the left. The bottom heatmap shows key clinical information about each patient, including their Sex, the Stage of their disease and their microsatellite status (instable, MSI; stable MSS). The barplot to the right shows the percentage of patients with a SNV or a CNA in that gene. The barplot at the top, equivalently, shows the number of SNVs and CNAs for each patient. Finally, the second barplot from the top categorizes all SNVs based on the type of base-change that mutation reflects, showing their proportion as a fraction of the total mutation number. Code used to generate this figure is available in Additional file 4