Fig. 2
From: Brick plots: an intuitive platform for visualizing multiparametric immunophenotyped cell clusters
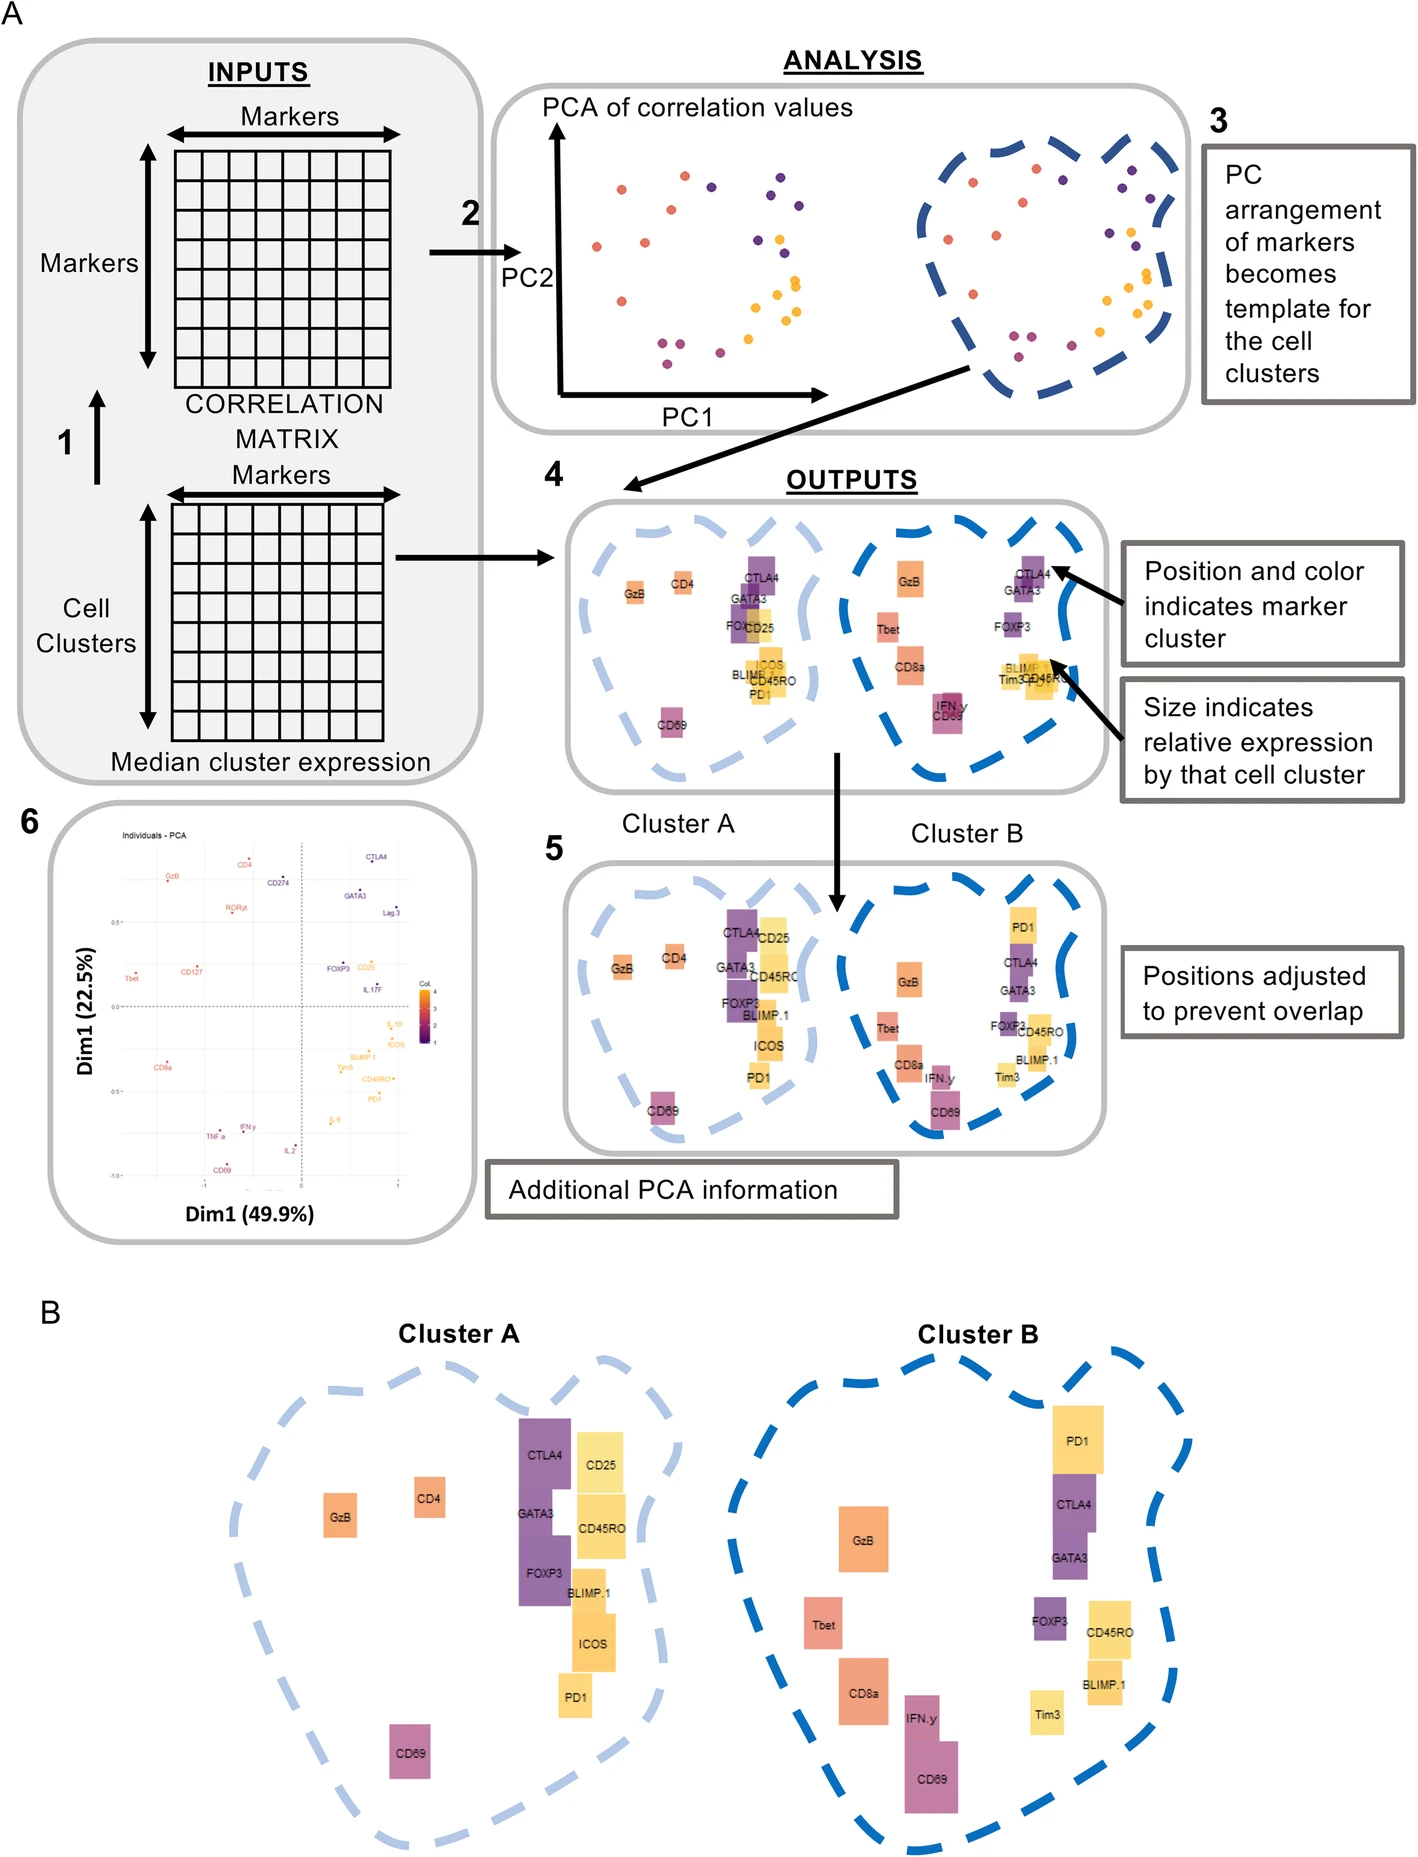
Generation of Brick plots. a Schematic of data processing to generate Brick plots. Brick plots require an input dataset comprising markers (columns) and samples/clusters (rows). (1) A correlation matrix is generated from the dataset and a principal component analysis performed on the matrix (2). Each marker is plotted based on its PC1, PC2 co-ordinate defining the location of each marker in the plot (3). Locations are coloured based on K-means cluster-assignation. Expression values for each marker in each sample are used to define the size of boxes to be plotted (4). Overlapping bricks are adjusted to remove overlap (5), initial locations are plotted with PC1/2% variance shown (6) b Example Brick plots for T cell populations generated from CRC patient cohort 1 tissue samples (pooled) acquired by mass cytometry (Additional file 5). Cluster A represents a CD4 T cell population. Cluster B a CD8 T cell population. Brick size indicates relative expression of the labelled marker, colour indicates marker cluster assignation, based on broad categories – orange represents T cell lineage and cytotoxic functions (CD4, CD8, Tbet, GzB); pink represents antigen exposure and effector function (IFN-γ, CD69); purple represents regulatory transcription factors and proteins (FOXP3, CTLA4, GATA3), and yellow represents activation and inhibitory receptors (CD25, CD45RO, BLIMP-1, ICOS, PD-1, Tim-3).