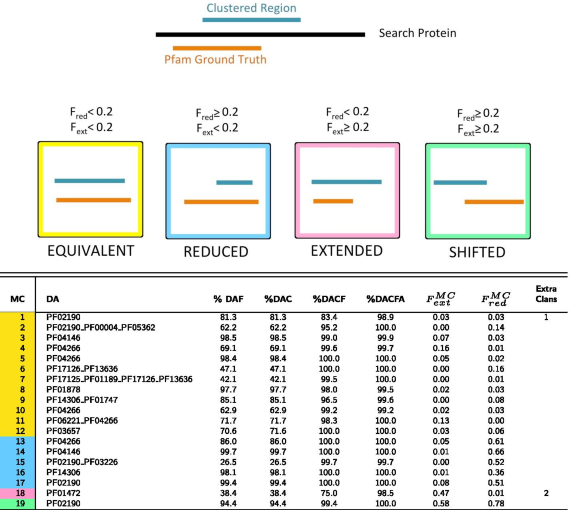
- Top panel: pictorial representation of how MCs are qualitatively classified based on the overlap between DA and DA members (additionally see “Methods” section for the definition of these categories). In the table, for each MC, we report: the family-level Pfam Dominant ground truth Architecture (DA); the percentage of members featuring a DA annotation either at the family (%DAF) or at the clan (%DAC) level, these are what we call DA members; %DAC plus the percentage of members lacking one or more of the DA clans but having no additional clan’s annotation (%DACF); %DACF plus the percentage of members having clans outside of the DA but at least one DA clan (%DACFA); for DA members, the average extent of the overlap with the DA, \(F_{ext}^{MC}\), \(F_{red}^{MC}\); the number of extra clans that feature in %DACFA (only those present in at least 5% of clan members). MCs are colored according to the overlap between DA members and DA annotation: equivalent (yellow), reduced (blue), extended (pink) and shifted (green)
