Table 1 BioConductor Quality Control Statistics
From: Unsupervised assessment of microarray data quality using a Gaussian mixture model
Quality Statistic1 | Description |
|---|---|
mean.raw.int, sd.raw.int, median.raw.int, interQuartile.raw.int | mean, standard deviation, median and inter-quartile range of raw log intensity distribution. |
q.5.raw.int, q.95.raw.int | 5th and 95th percentile of raw log intensity distribution. |
slope.bias, p.bias | slope parameter and associated p-value of linear regression of log expression level versus probe number, as computed by R affy library function AffyRNAdeg(). |
mean.norm.int, sd.norm.int, median.norm.int, interQuartile.norm.int, q.5.norm.int, q.95.norm.int | mean, standard deviation, median, inter-quartile range, and 5th and 95th percentiles of normalized log intensity distribution. |
PLM.w.q.0.001, PLM.w.q.0.01, PLM.w.q.0.1, PLM.w.q.0.2 | 0.1th, 1st, 10th and 20th percentile of the probe-level model weights, computed using affyPLM library functionality. |
PLM.res.q.0.01, PLM.res.q.0.1, PLM.res.q.0.25, PLM.res.q.0.75, PLM.res.q.0.9, PLM.res.q.0.99 | 1st, 10th, 25th, 75th, 90th, and 99th percentile of probe-level model residuals, computed using affyPLM library functionality. |
RLE.median, RLE.interQuartile, RLE.lower.whisker, RLE.upper.whisker | median, inter-quartile range, lower tail and upper tail of "relative log intensity", computed using affyPLM library functionality. |
- 1. The "SCORE" function was used to normalize values for each statistic, t, for each chip, i, relative to the values observed in other chips from the same experiment:
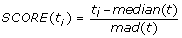 ; with median() and mad() computed across all chips in the experiment.
 ; with median() and mad() computed across all chips in the experiment.