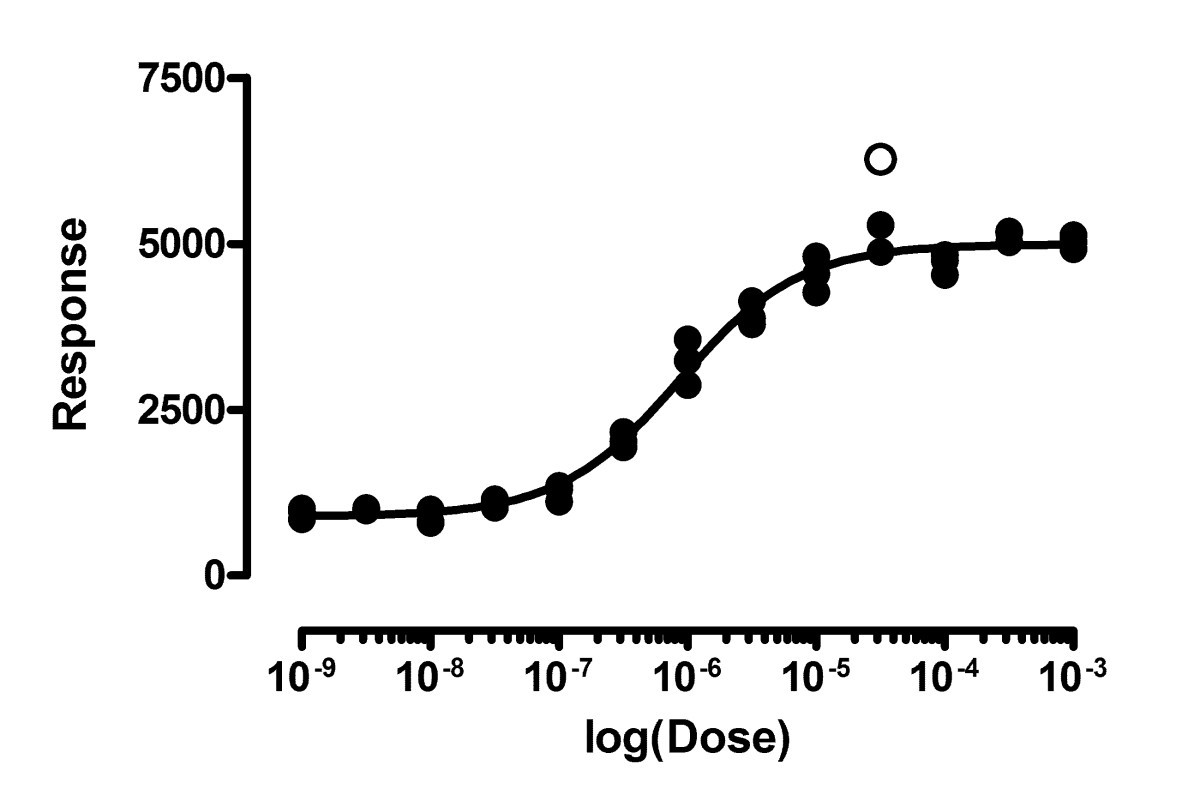
Figure 4

Identifying extreme outliers. This shows the first of 5000 simulated data sets with a single outlier (open symbol) whose distance from the ideal curve equations 7 times the standard deviation of the Gaussian scatter of the rest of the points. Our method detected an outlier like this in all but 5 of 5000 simulated data sets, while falsely defining very few good points to be an outlier (False Discovery Rate = 1.18%).