Fig. 1
From: BPG: Seamless, automated and interactive visualization of scientific data
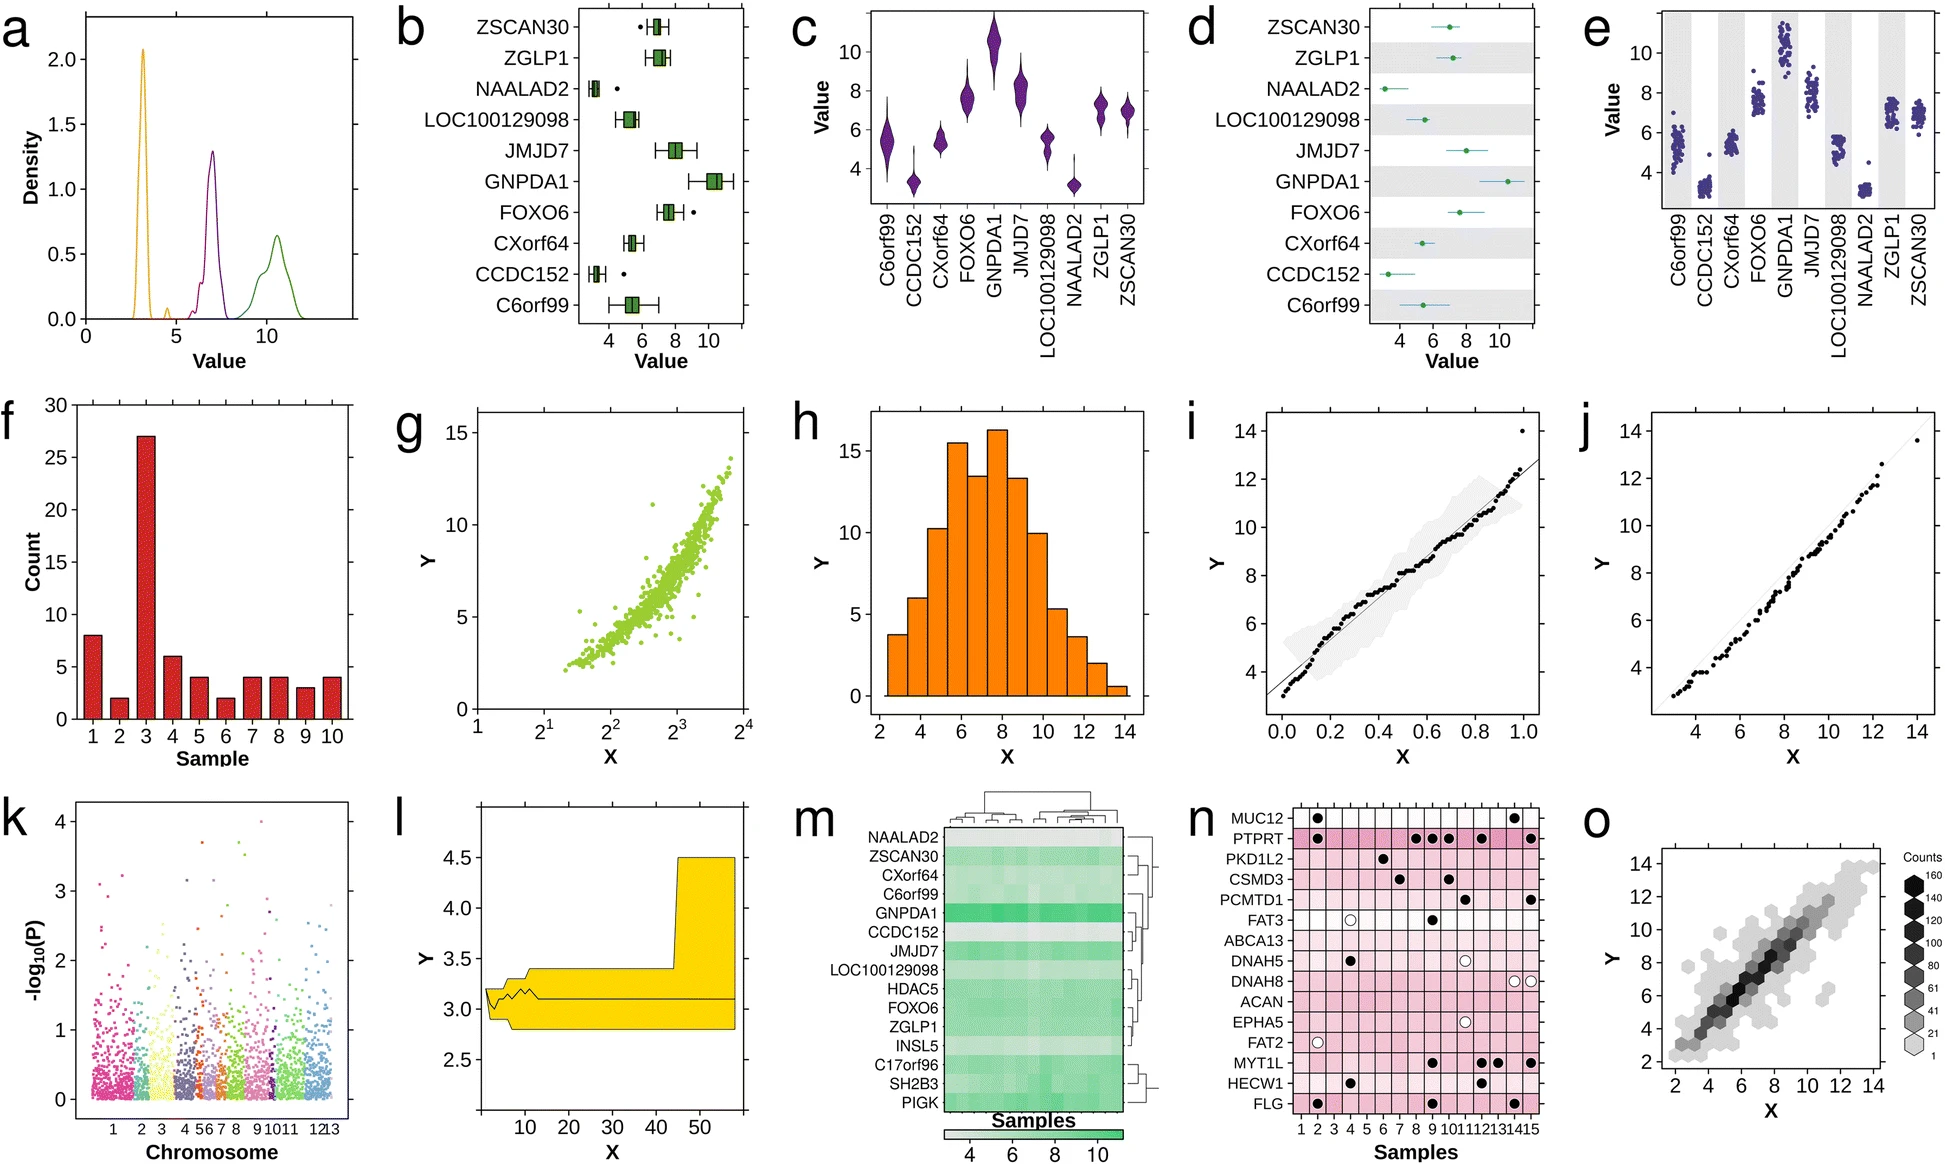
Available chart-types. The basic chart-types available in BPG: a density plot, b boxplot, c violin plot, d segplot, e strip plot, f barplot, g scatterplot, h histogram, i qqplot fit, j qqplot comparison, k Manhattan plot, l polygon plot, m heatmap, n dotmap and o hexbinplot. All plots are based upon the datasets included in the BPG package and code is given in Additional file 1