Fig. 8
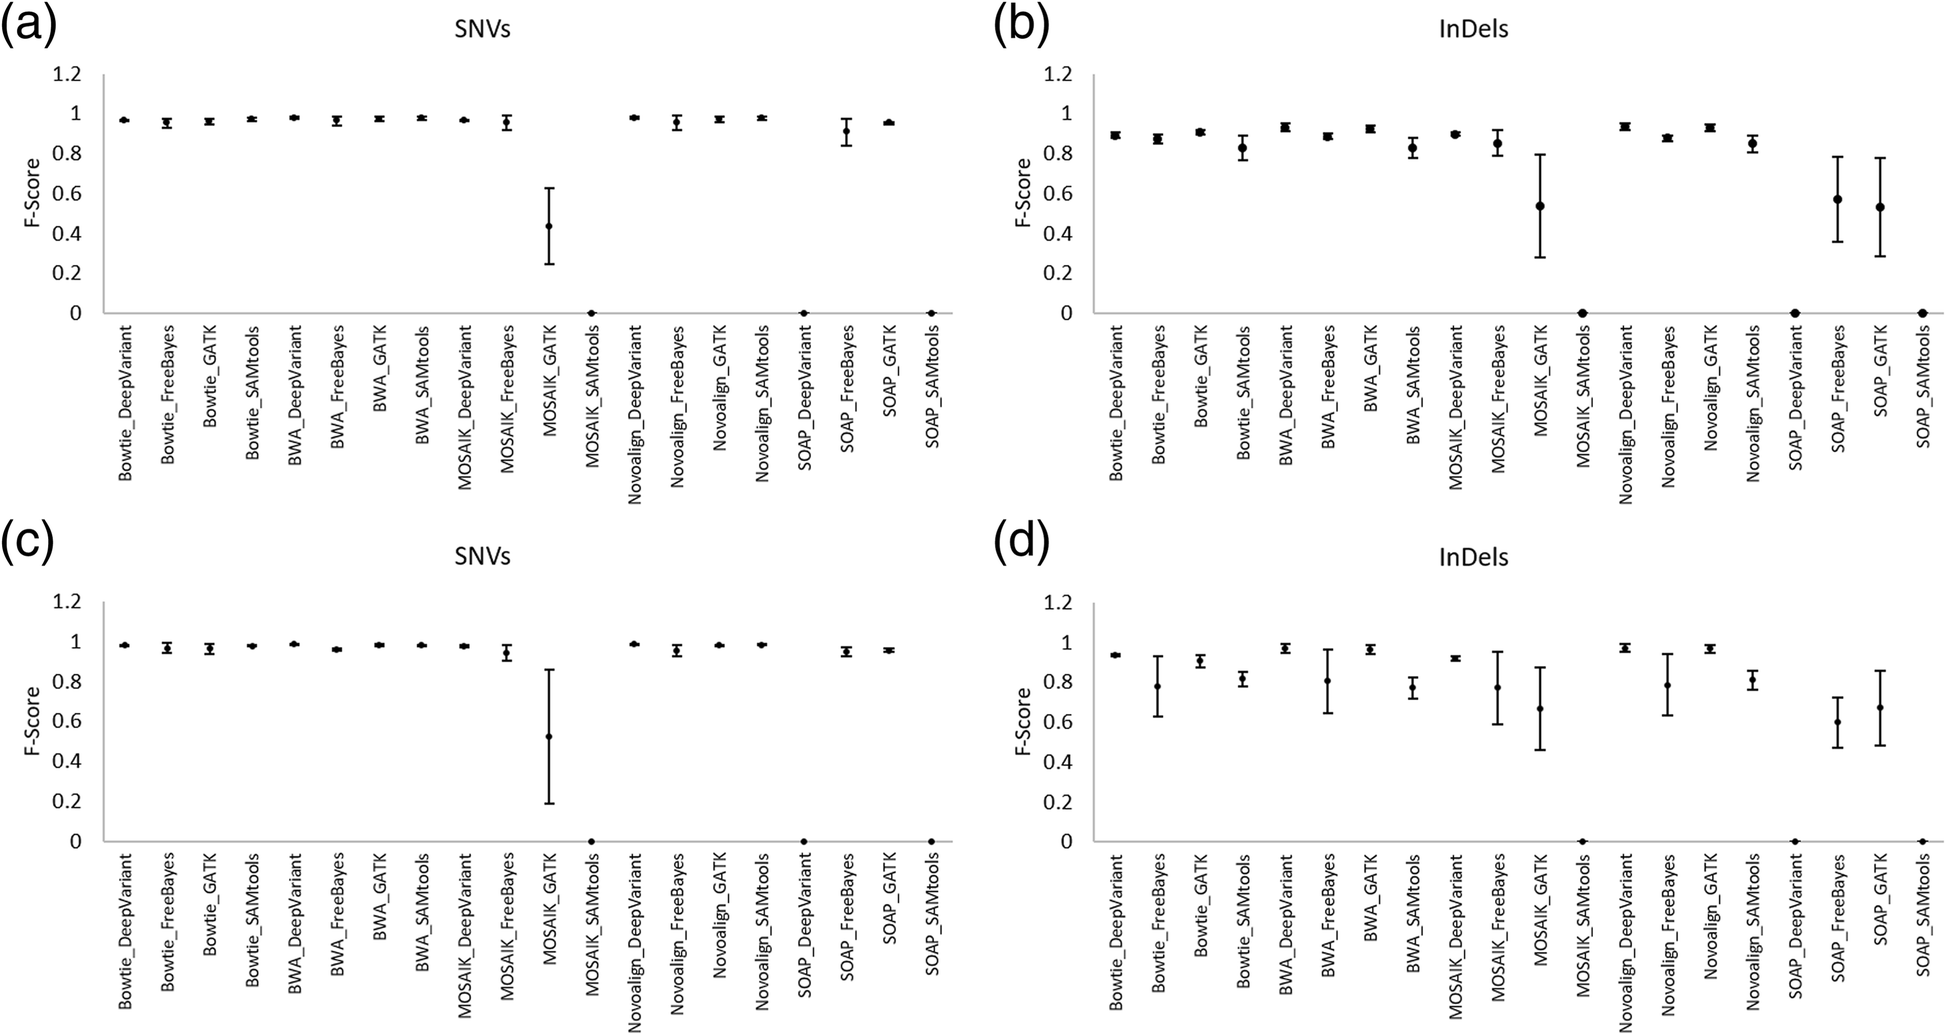
Performance comparison of pipelines using F-score on NA12878, NA24385, and NA24631. The values and the error bars represent the average and standard deviation of F-score respectively, obtained from all three datasets. Performance comparison of pipelines in detecting SNVs GRCh38 (a, b) and InDels GRCh37 (c, d)