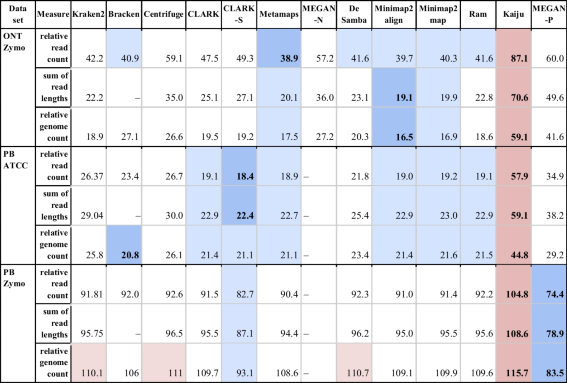
- The table shows the total abundance estimation error for mock community datasets for three definitions of relative abundance: (1) the percentage of reads classified to a species, (2) the percentage of genome lengths (sum of read lengths) classified to a species and (3) the percentage of genomes classified to a species. The total error was calculated as the L1 distance between specific types of abundances reported by tools and the abundances declared by vendors and summed up across all organisms (all present and all reported). In a row, cells with values close to the best are highlighted with a blue background, and those close the worst are marked in red. The best and worst values are further set apart with bold text and a more intense hue of their corresponding background colors. Unfortunately, due to its long-running time, results for MEGAN-N are unavailable for datasets PB_Zymo and PB_ATCC. It is important to note that Bracken produces only read counts assigned to a taxonomic rank. Therefore, to compare it with other tools, abundances—the percentage of genomes of species in the sample, were calculated by normalising read counts with the average genome length of the species to which corresponding read counts were assigned
