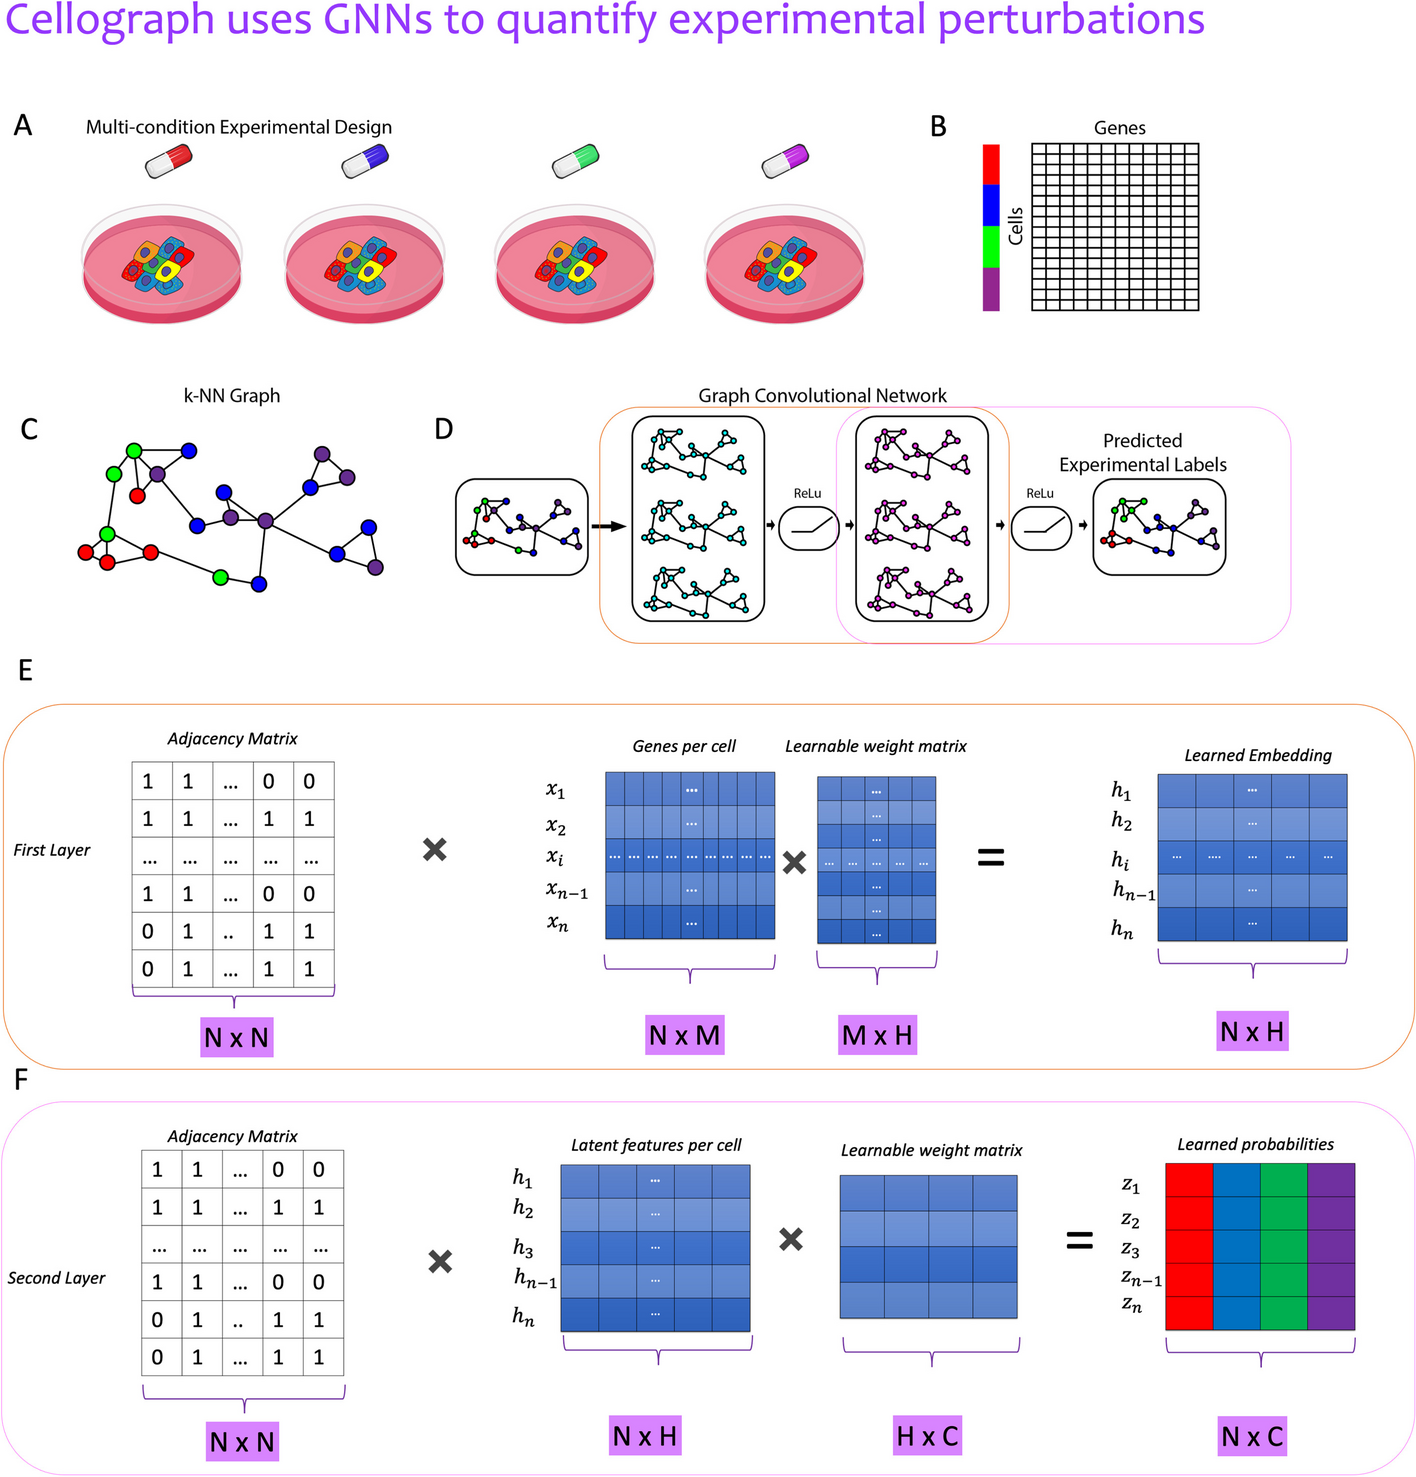
Fig. 1

Illustrative overview of Cellograph algorithm. Single-cell data collected from multiple sample drug treatments (A, B) is converted to a kNN graph (C), where cells are nodes, and edges denote connections between transcriptionally similar cells. The colored rectangles (B) correspond to the different samples represented by the drugs in A. This kNN is fed in as input to a two-layer GCN (D) that quantitatively and visually learns how prototypical each cell is of its experimental label through the learned latent embedding. E A mathematical schematic of the first layer, where each cell’s gene expression and its neighbors’s gene expression is aggregated to produce a lower-dimensional representation of the cell in a latent space. F A mathematical schematic of the second layer respectively, where the output embedding of the first layer is mapped to softmax probabilities of cells belonging to each of the drug treatments