- Research
- Open access
- Published:
CamurWeb: a classification software and a large knowledge base for gene expression data of cancer
BMC Bioinformatics volume 19, Article number: 354 (2018)
Abstract
Background
The high growth of Next Generation Sequencing data currently demands new knowledge extraction methods. In particular, the RNA sequencing gene expression experimental technique stands out for case-control studies on cancer, which can be addressed with supervised machine learning techniques able to extract human interpretable models composed of genes, and their relation to the investigated disease. State of the art rule-based classifiers are designed to extract a single classification model, possibly composed of few relevant genes. Conversely, we aim to create a large knowledge base composed of many rule-based models, and thus determine which genes could be potentially involved in the analyzed tumor. This comprehensive and open access knowledge base is required to disseminate novel insights about cancer.
Results
We propose CamurWeb, a new method and web-based software that is able to extract multiple and equivalent classification models in form of logic formulas (“if then” rules) and to create a knowledge base of these rules that can be queried and analyzed. The method is based on an iterative classification procedure and an adaptive feature elimination technique that enables the computation of many rule-based models related to the cancer under study. Additionally, CamurWeb includes a user friendly interface for running the software, querying the results, and managing the performed experiments. The user can create her profile, upload her gene expression data, run the classification analyses, and interpret the results with predefined queries. In order to validate the software we apply it to all public available RNA sequencing datasets from The Cancer Genome Atlas database obtaining a large open access knowledge base about cancer. CamurWeb is available at http://bioinformatics.iasi.cnr.it/camurweb.
Conclusions
The experiments prove the validity of CamurWeb, obtaining many classification models and thus several genes that are associated to 21 different cancer types. Finally, the comprehensive knowledge base about cancer and the software tool are released online; interested researchers have free access to them for further studies and to design biological experiments in cancer research.
Background
High throughput sequencing technologies represent a true revolution in the field of molecular biology. Particularly in cancer applications, Next Generation Sequencing (NGS) methodologies have given great impetus to biomedical research approaches in the perspective of personalized medicine [1–6]. Thanks to NGS based experiments, which are becoming cheaper and cheaper, a huge amount of biological data is being generated. However, these data must be collected, organized, and interpreted in order to be made available to the scientific community [7].
In this work, we focus on the RNA sequencing (RNA-seq) NSG experiment [8] for quantifying the gene expression across the transcriptome in a given tissue [9, 10]. Indeed, studying the quantification of the transcriptome enables to understand which genes are activated at different phases of the cell cycle or in the development of pathological conditions. We consider RNA-seq NGS experiments related to tumoral samples extracted from the Genomic Data Commons (GDC) [11], a web portal dedicated to cancer care and prevention, which is an evolution of the The Cancer Genome Atlas (TCGA) [12]. The GDC is the result of an initiative funded by the National Cancer Institute (NCI) [13] with the aim of creating a unified data system that can promote the sharing of genomic and clinical data among researchers. The GDC portal publicly provides dataset of the following genomic experiments of more than 40 tumor types: DNA sequencing, Copy Number Variation, Somatic Mutations, DNA Methylation Gene Expression Quantification, and miRNA Expression Quantification. These datasets are retrievable with: (i) The GDC Data Portal [14], a web portal that allows browsing, retrieving, and downloading genomic and clinical data; (ii) The GDC Data Transfer Tool [15], a standard client-based software for high performance batch access; (iii) The GDC Application Programming Interface (API) [16] that allows programming or command line access, for searching and downloading subsets of data files based on specific parameters. Thanks to these precious retrieval tools, the GDC provides researchers and medical doctors with the largest repository of tumoral data collected from thousands of patients, potentially allowing several analyses on all actually known tumor types. However, in order to fully exploit this big data repository, new methods for extracting knowledge are required [7].
Data mining, a set of techniques and methodologies for extracting knowledge from large amounts of data, is a natural way to approach this task [17, 18]. Data mining techniques and algorithms point to the identification of patterns, which can be repeated under certain conditions. For example, a genomic pattern, which can be crucial for verifying or even recognizing a pathological condition related to a particular disease, could be identified. When a certain relationship is identified in the data mining process, the concept of learning this relationship is considered and this process is called machine learning [19]. Learning can take place with different approaches; in this work, we consider supervised learning techniques [20] (i.e., classification), which can be applied when in the analyzed dataset each element is associated to a finite set of properties (also called class). In particular, we focus on rule-based classifiers, where the pattern to be found is a set of conditions for which a certain class can be assigned to a sample. The rules are therefore logic formulas that bind a subset of features of the samples to their class label. Example of a logic formula or (“if then” rule) on gene expression data is the following “if ENSG00000167676.3 < 16.15 OR ENSG00000166819.10 < 15.28 then the sample can be classified as tumoral”. Several rule-based machine learning methods are available for the analysis of gene expression data, e.g., [21–24]. The reader may find a more detailed survey of these methods in [10].
Among them, we focus on a new supervised learning method that is able to extract more knowledge in terms of classification models than state of the art ones, called Classifier with Alternative and MUltiple Rule-based models (CAMUR) [25]. CAMUR is designed to find alternative and equivalent solutions for a classification problem building multiple rule-based classification models. Standard classifiers tend to extract few rules with a small set of features for discriminating the samples, and interesting features may remain hidden from the researcher. Thanks to an iterative classification procedure based on a feature elimination technique, CAMUR finds a large number of rules related to the classes present in the dataset under study. CAMUR is based on: (i) a rule-based classifier, i.e., RIPPER (Repeated Incremental Pruning to Produce Error Reduction) [26]; (ii) an iterative feature elimination technique; (iii) a repeated classification procedure; (iv) a storage structure for the classification rules. The method calculates iteratively a rule-based classification model through the RIPPER algorithm [26], deletes iteratively the features that are present in the rules from the dataset, and performs the classification procedure again, until a stopping criterion is met, i.e., the classification performance is below a given threshold or the maximum number of iterations set by the user has been reached. CAMUR has been implemented particularly for RNA-seq classification and case-control studies, i.e., specific studies that aim to identify subjects by their outcome status (e.g., tumoral or normal). In these data, the features correspond to the gene expressions of the samples, the classes to the investigated diseases or conditions (e.g., tumoral, normal). The extracted knowledge by CAMUR consists in a set of rules composed of a given number of genes that might be relevant for a disease. CAMUR also includes an offline tool to analyze and to interpret the computed results. Thus the software consists of two parts: (i) The Multiple Solutions Extractor (MSE), which corresponds to the implementation of the iterative classification algorithm (i.e., for each iteration it deletes the selected features, performs the classification, and saves the extracted models); (ii) The Multiple Solutions Analyzer (MSA), which is the graphical tool for analyzing and interpreting the obtained results. CAMUR is available at http://dmb.iasi.cnr.it/camur.php as stand alone software; for a comprehensive description we point the reader to [25].
In this work, we propose CamurWeb, a web implementation of CAMUR that is able to extract multiple rule-based classification models from RNA sequencing experiments and to create a large knowledge base of these rules. Moreover, we apply CamurWeb to all public RNA sequencing datasets extracted from The Cancer Genome Atlas database, obtaining a large open access knowledge base of classification rules related to several cancer types. Thanks to its user friendly interface, the tool allows to execute the software CAMUR, to query the results, and to manage the analyzed experiments.
Implementation
This section introduces CamurWeb, the application designed and developed in this work. CamurWeb is a web service that aims to make the CAMUR software easily accessible and usable. CAMUR was developed in 2015 for the analysis and classification of genomic data, in particular to classify RNA-seq experiments and to extract an interesting body of rule-based classification models. The software and its algorithm are presented briefly at the end of the Background section. CAMUR has two main innovative aspects with respect to many machine learning algorithms: i) it derives many possible classification models and ii) it stores them to allow further and deeper analyses.
CamurWeb is designed to support these two aspects, making easy to exploit these two powerful functionalities even for a non specialized user. Before the release of CamurWeb, in order to run CAMUR the following tasks had to be performed by the user:
-
install and configure a valid Java Virtual Machine [27];
-
install and configure a MySQL database management system [28];
-
download the CAMUR software package composed of the Multiple Solutions Extractor (MSE) and the Multiple Solutions Analyzer (MSA);
-
start the MSE via the command line with its parameters;
-
wait for the execution to complete;
-
start MSA via the command line, and save the results of CAMUR by querying the interface.
These steps require time and effort and a good knowledge of computer usage. Conversely, CamurWeb allows using CAMUR in a fast and an intuitive way with a simple interface, directly through the browser without the need to install software or dealing with configurations. In the next paragraphs, we will describe the application requirements, and then deepen the architecture and its development.
CamurWeb portal
The CamurWeb portal supports three main tasks:
-
it permits to freely access, query, and visualize the large knowledge base of classification results (datasets, logic formulas, performance, and statistics) obtained running CAMUR on all public available RNA sequencing datasets of TCGA extracted from GDC;
-
it enables the users to run the software online and to view the results of their classification analyses;
-
it allows to download the CAMUR software package.
Therefore, CamurWeb home page is composed of three main sections, as depicted in Fig. 1: in the first one the users can perform the classification analyses, in the second one they can view the public analyses performed on the cancer datasets extracted from TCGA, and in the third one they can download the CAMUR software package.

The homepage of CamurWeb
The main users of CamurWeb can be of two types: the unregistered user, who can mainly access to the public results and repository about cancer; the registered one, who can run the classification software, save the performed analyses, and view her private as well as the public results.
In particular, the unregistered user can (i) learn and deepen the CAMUR classification tool: a section of the website is dedicated to briefly present the software and the web platform, and redirects the user to the bibliographic and web resources that deepen CAMUR; (ii) view the results of the classification analyses performed on 21 cancer datasets extracted from the Genomic Data Common (GDC) portal (detailed results of these analyses will be presented in “Results and discussion” section); (iii) ask for additional information or custom solutions through a simple form; (iv) sign up to the system simply by specifying an email and a password.
The registered user can perform all the previous operations and additionally has the possibility to: (i) perform a classification analysis with CAMUR by using a wizard, which allows to upload a dataset or choose from a set of existing ones containing data extracted from the GDC portal, set the parameters, and run the classification; (ii) view the classification results, i.e., the rule-based classification formulas, charts, and tables; then the user can query the database to see the results and export them; (iii) see a personal section with a report of the analyses started on the system and with her profile information. In order to run a classification task on a private dataset (see Fig. 2) the user must be registered. The system alerts the user with an e-mail at the end of the execution. This is another strength of CamurWeb, because processing a dataset with CAMUR can take few minutes to hours; so the user does not have to wait for the end of the execution connected to the system or with her computer turned on. The input file format of the CamurWeb classification online procedure is a standard comma separated values (csv) text file containing the data matrix of the RNA-seq experiments. For further details about the input format, we point the reader to the user guide of CAMUR available at http://dmb.iasi.cnr.it/camur.php.

The classification section of CamurWeb
The results of the access to the knowledge base, either the public or the private ones produced by running CAMUR, are reported on a results page (see Fig. 3). In this page CamurWeb shows: (i) a table with information about the uploaded file and the experiment, in particular the number of rows, which corresponds to the number of samples; the number of columns, which corresponds to the number of features; the size of the file; the time it took for the classification; the number of iterations chosen for the classification, and the number of extracted rules; (ii) a pie chart with the classes in the dataset with the percentage and number of samples; (iii) another table with the list of features extracted by the classifier and their number of occurrences; if the features are genes contained in the Ensembl database [29], the link leads to the page at www.ensembl.orgwith a description of the genes. Additionally, in the same page the user can perform the following knowledge extraction queries:
-
Features List: extracts the list of genes and their occurrences in all the classification models obtained in the considered analysis;
Fig. 3 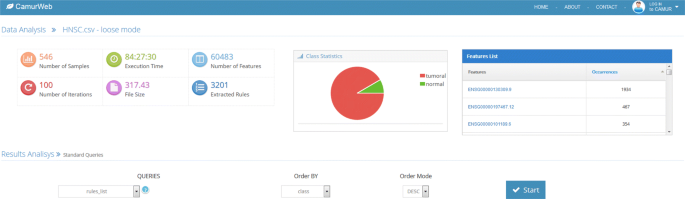
The results page of CamurWeb
-
Literals and conjunctions list: identifies the conjunctions of the literals present in the rules; for each one the number of correct and incorrect instances and their percentages are returned;
-
Rules list: extracts the literal disjunctions with their precision and accuracy;
-
Literals statistics: returns more detailed statistics on the extracted genes and their thresholds;
-
Feature pairs: extracts the pairs of genes present in the same rule and counts how many times they appear together.

The results of such queries can be visualized or downloaded.
Tools and technologies
This section briefly presents the technologies and tools used for the CamurWeb application development.
CamurWeb is written in the Javascript programming language [30], which is suited not only for client-side applications but also for server-side ones. The Node.js framework [31] is adopted in this project. Node.js is a platform created on the Javascript engine, which allows to create fast and scalable web applications. The main features of Node.js are (i) an orientation towards the development of asynchronous code; (ii) a modular architecture; (iii) an optimized transmission of information through the HTTP connection. In addition to the APIs provided by Node.js, we use the Express.js library [32], a Node.js based framework that offers a robust set of functionalities to easily build single-page, multi-page, and hybrid web applications. It is a mature framework that offers several features including middleware, routing, the ability to manage application configurations in an easy way, and a template engine. Moreover, JQuery [33], a JavaScript library for web applications, is adopted in CamurWeb. It is born with the goal of simplifying selection, manipulation, event management, and animation in HTML pages. The jQuery library allows us to simplify JavaScript by writing complex instructions in one line. Additionally, the Bootstrap JavaScript library [34] is used for the development of the web interface. For managing the different executions of CAMUR, we adopt the REmote DIctionary Server (REDIs) [35], which is one of the most popular key-value databases. In CamurWeb, REDIs is used in Node.js for supporting the development of execution queues. It is used to handle a queue for CAMUR executions requested by the users. The maximum number of parallel executions of CAMUR is set in the application configuration file: a job being in the queue only starts if the number of active runs of CAMUR is less than the maximum number, otherwise the job is entered in the queue. Finally, CamurWeb uses MySql [28] as database management system in order to store the users identification data and the results of their analyses. In particular, the structure designed and used by CAMUR has been extended with new tables for the purposes. The MySql library is integrated in Node.js.
Software architecture
CamurWeb follows the standard client-server model, i.e., the reference architecture for web applications [36]. In particular, CamurWeb uses is the Model-View-Controller (MVC) architectural pattern that allows to decouple the different components of the application to gain benefits in terms of reusability and maintenance [37]: Model contains data access methods; View takes care of displaying data to the user and manages the interaction between the user and the underlying infrastructure; Controller receives user commands across View and reacts by performing operations that may affect the Model and which generally lead to a View state change.
The software architecture of CamurWeb is shown in Fig. 4 and described in the following. The software is composed of four main components and six other stand alone software modules. The Controllers component contains the routes of the application. Routes play a primary role: their job is to translate the different request urls by addressing the call to the correct function on the server. The Views component contains the software modules that constitute the web application interface described more in detail in “CamurWeb portal” subsection. The Models component contains the software modules that interact with the database. All operations that need to retrieve data from the database, insert, or update it, are handled by these modules. The Helpers component contains support software modules for the web application, e.g., the statistics functions, the send email facility, and the CAMUR executor. Finally, six additional stand alone modules are part of the software architecture: the node modules, which group the system libraries of Node.js; the config module, which contains the configuration files of the software; the CAMUR module, which contains the CAMUR software package; the public module, which contains useful files for the GUI; the file module, which manages the storage of the users’ file and of the public datasets; and lastly the test module, which manages the public analyses and the private ones performed by the different users.

The software architecture of CamurWeb
Results and discussion
In order to prove the validity of CamurWeb, we performed a classification analysis on all public available RNA sequencing datasets of The Cancer Genome Atlas database extracted from the Genomic Data Commons portal. For each dataset we obtain a large body of accurate classification models, which are composed of rule-based classification formulas containing many genes and their association to a particular cancer type. With these models we build a large knowledge base about cancer focusing on the extracted genes. Interested researchers and medical doctors can access these knowledge on our public section “See cancer classification” available at http://bioinformatics.iasi.cnr.it/camurweb. In the following, we describe the analyzed data and some of the obtained results.
Analyzed data
The data selected for the analyses are extracted from the Genomic Data Commons (GDC) portal through its APIs [16] (scripts to download ad process data are available upon request). GDC collects, standardizes, and makes accessible large amounts of genomic and clinical data with the purpose of favoring and helping researchers to cure and prevent cancer. For more details about GDC, we point the reader to “Background” section and to [11]. In this study we focus on data of RNA-seq, which provides a comprehensive view of the transcripts of a cell, can identify new transcripts, is able to monitor splicing events, and permits to quantify gene expression. For this reason RNA-seq is considered a valid tool for a deep understanding of tumor processes. Therefore we select from the GDC portal all publicly available RNA-seq TCGA data, which are composed of gene expression measures on 9030 diseased and healthy tissues (92.6% and 7.4%, respectively). These data are obtained by adopting the Illumina HiSeq 2000 RNA Sequencing Version 2 (RNA-seq V2) platform [38] and are collected in GDC by the Cancer Genomic Characterization Center (CGCC) University of North Carolina. The public available tumors are 30, each one consisting of a set of samples taken from healthy tissues or diseased ones: healthy tissues are labeled in GDC with the term “normal” and diseased ones with the term “tumoral”. For each tissue GDC provides 60,483 gene expression values expressed with the Fragments Per Kilobase per Million mapped (FPKM) measure [39–41].
In order to be classified, the downloaded data are processed and transformed into a matrix format. We build a matrix for each tumor containing the FPKM gene expression values: the rows correspond to the samples, which range from 45 for the CHOL tumor to 1222 for BRCA; the first column represents the sample identifier; the central columns correspond to the 60,483 genes, whose expression is measured and which are identified by their Ensembl ID [29]; the last column represents the class of the sample (normal or tumoral); the element cij contains the FPKM value of the sample i measured on the gene j. An example of data matrix is shown in Table 1. Scripts for the conversion and assembly of the GDC data to a matrix format are available upon request. The input of CamurWeb is am RNA-seq matrix encoded in a comma separated values (csv) text file. In Table 2 we show the main characteristics of the obtained matrices. As the reader can see, RNA-seq experiments of cancers ACC, DLBC, LAML, LGG, MESO, OV, TGCT, UCS, and UVM only include samples of tumoral tissues. Therefore it is not possible to perform a supervised classification analysis of such cancer datasets.
Classification analyses and creation of the knowledge base
We performed the classification analyses through the CamurWeb platform on all datasets containing normal and tumoral tissues. The parameters of CAMUR have been set as follows: the execution mode to loose, the maximum number of iterations to 100 and the minimum F-measure value to 0.8. The execution mode indicates how CAMUR runs, the loose mode is slower than the strict one, because computational complexity grows exponential to the number of features. On the other hand the loose mode permits to extract more knowledge with greater accuracy (F-measure). The maximum number of desired iterations of CAMUR is set to 100; this means that CAMUR is going to perform 100 runs each one with several classification procedures. The minimum F-measure is the value below which the classification results are not considered. CAMUR will stop after the maximum number of iterations has been reached or if the F-measure of all current runs is below the given threshold. For further details about the parameters setting, the reader may refer to [25]. The classification analyses have been performed on an Intel i7 workstation with 24 GB of RAM and by using the CentOs 7 64bit linux operating system with kernel 3.10.0-514.26.2.el7.x86_64. We executed 3 analyses concurrently. A total of 21 analysis tasks have been accomplished, resulting in more than 10,000 classification procedures.
Table 3 shows the results in terms of running time, number of inferred rules, and number of extracted genes (features). By comparing the results reported in Table 3 with the characteristics of the datasets shown in Table 2, we can draw some considerations regarding the link between the number of samples of the dataset and the execution time. The running time of CAMUR is not directly proportional to the number of samples (the number of rows) of the considered dataset. The number of samples actually affects only execution time of a single iteration of the CAMUR classifier; what determines the total time of the execution is the number of iterations. CAMUR continues its iterations since one of the stopping criteria is verified: (i) the maximum number of iterations imposed by the user is reached; (ii) the F-measure values are smaller than the threshold set by the user; (iii) all possible combinations are eliminated from the set of features.
The fastest analyses, where not all 100 iterations are executed, are CESC, CHOL, KICH, KIRP, LUSC, READ, and THYM. In fact, in these analyses a small number of rules are extracted and consequently a small set of relevant genes is obtained. The cause can be a combination of the stopping criteria (ii) and (iii): it is possible that the rules extracted after the first iterations do not exceed the minimum value of F-Measure (0.8), and hence all their genes are not considered. The consequence is that the set of genes does not increase and the combinations to be eliminated from the original dataset quickly becomes empty.
It is worth to note that for the BLCA, BRCA, GBM, HNSC, KIRK, LIHC, LUAD, PCPG, SARC, STAD, UCEC tumors CAMUR extracted a high number of rules and many features (genes) that are potentially involved in the tumoral processes. For the other tumors CAMUR extracted a smaller set of genes that are related to the cancer under study.
As an example Fig. 5 shows the results page of the classification analysis on the LUSC tumor. The reader can see that among the extracted features the ADGRF5 gene with Ensembl ID ENSG00000069122.17 is the one that occurs most in the classification rules. Previous studies have already shown that mutations within this gene are possible causes of lung cancer (LUSC) [42]. Similarly, many other genes extracted from the classification rules of LUSC are listed in several publications that concern this tumor [43].

The results page of the classification analyses on the LUCS tumor
The CHOL and KICH tumors are characterized by a small set of tissues (45 and 89) though with a percentage of normal ones greater than others. The classification analyses on these two tumors did not produce many rules, but for all the extracted ones the F-Measure and the accuracy was 1, i.e., no classification errors occurred.
Other examples and some considerations are reported in the following.
Head and Neck squamous cell carcinoma (HNSC)
HNSC is one of the analyses with higher execution time, because the CAMUR software was able to run 3201 classification procedures producing rules with accuracy values ranging from 0.95 to 1 and extracting 1363 genes. In Table 4 we report the genes that are most represented in the rules. We can see that the COLGALT1 gene with Ensembl ID ENSG00000130309.9 is the one that appears in the largest number of rules (1934 rules out of 3201). By examining more deeply the rules, this gene has an FPKM value above 18.16 in all tumoral tissues. Similar observations can be made for the genes COL13A1 (ENSG00000197467.12), MRGBP (ENSG00000101189.6), and following. Such examinations can be at a basis for targeted research and studies about cancer. Another investigation can be made with CamurWeb by studying pairs of genes that appear often together in the classification rules. This information can be obtained from the CamurWeb database with a simple query called “feature pairs”. We report part of the results for the HNSC tumor in Table 5. As the reader can see, the genes COLGALT1 (ENSG00000130309.9) and AC012531.25 (ENSG00000260597.1) is the most frequent couple that appears in the rules occurring 250 times. In particular, AC012531.25 is always extracted together with COLGALT1, because its number of occurrences as single gene is exactly 250. Even this investigation generates important results in helping to understand the genetics of cancer.
Liver hepatocellular carcinoma (LIHC)
For this tumor CAMUR has identified 854 genes by running 1890 classification procedures. In this dataset the percentage of normal tissues (12.5%) is higher than in other tumors. In Table 6 we show the most represented genes that occur in the rules. It is worth noting that the GABRD (ENSG00000187730.7) gene is the most represented one, followed by the TOMM40L (ENSG00000158882.11) gene. Existing studies on the GABRD gene confirm that alterations in its expression can play a key role in differentiating tumor cells. In particular, an abnormal regulation leads to its overexpression that can cause the proliferation of tumor cells [44]. Regarding the second gene, a study has been published that relates the alteration of TOMM40L expression to the excess of smoke in humans [45]. In this study, the authors relate the effect of smoke and the elevated expression of TOMM40L by concentrating on neurodegenerative diseases such as Alzheimer’s and Parkinson’s. The findings of CamurWeb can be objective of future studies on this gene (and on other ones) that focus on cancer.
Breast Invasive Carcinoma (BRCA)
Analyses on the BRCA dataset are particularly interesting for the large number of available tissues (1222, 1102 tumoral, and 120 normal). Breast cancer is the most common tumor in the female population and represents 29% of all tumors affecting women. For this reason it is deeply studied, and we can find in literature a lot of findings about it. CAMUR executed 30 iterations on the BRCA dataset producing 3015 rules and extracting 1847 genes with a running time of 190 hours and 29 minutes. In Table 7 we report the most frequent genes that are present in the obtained classification rules. We highlight that previous research confirms the relationship between the alteration of the expression of the first three most occurring genes - SPRY2 (ENSG00000136158.9) [46], VEGFD (ENSG00000165197.4) [47], and MMP11 (ENSG00000099953.8) [48] - and the predisposition to Breast Cancer.
Conclusions
In this work, we described CamurWeb, a new web portal for classifying NGS data of RNA sequencing and for sharing the obtained results. CamurWeb is a web application based on NodeJs, ExpressJs, and MySQL, which makes use of the CAMUR classification software. CAMUR is able to compute a large body of knowledge by finding a high number of genes that are likely to be involved in the processes that cause the formation of tumors. Conversely, state of the art rule-based classifiers extract from a dataset a set of two or three rules that describe it. However, this small set of rules may be insufficient to describe the data in a comprehensive way and to extract sufficient knowledge from it.
In order to prove the validity of CamurWeb and to release a large knowledge base of classification rules about cancer, we performed a wide supervised analysis on gene expression data belonging to more than 9000 patients and 21 different tumor types of The Cancer Genome Atlas extracted from the Genomic Data Commons portal. The obtained results were evaluated in terms of performance, execution times, and extracted features (genes related to a particular type of tumor). Among those genes, we identified a part of them already linked to the literature about cancer, confirming our classification procedure, and another part that still has to be investigated; this could be the starting point for new research studies. The identified genes can act as possible diagnostic and prognostic markers or therapeutic targets. All the extracted knowledge, the classification results, and the selected genes have been made public on the CamurWeb platform and can be consulted or queried for further investigation by biologists, medical doctors, and bioinformaticians in order to prove their association to a particular cancer.
Topics of future work may concern both the extension of the performed analyses and the development of new features for the CamurWeb application. Regarding the analyses, we plan to (i) investigate the role of the extracted genes for the different analyzed tumors and to compare them with existing studies; (ii) perform a set theoretic analysis of the extracted logic formulas in order to find common biomarkers among the studied cancers; (iii) repeat the classification analyses with the same data, but using different parameters, and then compare the results both in terms of extracted features, execution time, and accuracy of the rules; (vi) perform other classification analyses with new data extracted from other gene expression databases (e.g., GEO [49]) or projects (e.g., TARGET); (v) increase the number of public analyses, using other input or other classification parameters.
Regarding the CamurWeb platform we plan to: (i) design and develop automatic procedures able to integrate, compare, and analyze the logic classification formulas stored in the database; (ii) add a feature that allows users to share their own analyses; (iii) expand the user profile page by entering a field that allows the user to add observations or personal considerations about the analyses; (iv) increase the number of queries that can be made on the results database produced by CAMUR.
To conclude, we wish to highlight that the CamurWeb software and the published knowledge base are promising research tools for performing analyses on new released data and for discovering novel insights about cancer.
Availability and requirements
Project name: CamurWeb. Project home page:http://bioinformatics.iasi.cnr.it/camurweb. Operating system(s): Windows, Linux, and MacOs. Programming language: Javascript and Java. Other requirements: An updated version (starting from 2016) of Firefox or Internet Explorer or Chrome. License: GNU General Public License, version 3 (GPL-3.0). Any restrictions to use by non-academics: Licence needed.
Abbreviations
- API:
-
Application program interface
- BED:
-
Browser extensible data
- BRCA:
-
Breast invasive carcinoma
- CNV:
-
Copy number variation
- COAD:
-
Colon adenocarcinoma
- CSV:
-
Comma separated values
- DLBC:
-
Lymphoid neoplasm diffuse large B-cell lymphoma
- DNA:
-
Deoxyribonucleic acid
- ESCA:
-
Esophageal carcinoma
- FTP:
-
File transfer protocol
- GBM:
-
Glioblastoma multiforme
- GDC:
-
Genomic data commons
- GFF:
-
General feature format
- GMQL:
-
GenoMetric query language
- GUI:
-
Graphical user interface
- HGNC:
-
HUGO gene nomenclature committee
- HNSC:
-
Head and neck squamous cell carcinoma
- HTTP:
-
Hyper text transfer protocol
- HUGO:
-
Human genome organisation
- ICGC:
-
International cancer genome consortium
- KICH:
-
Kidney chromophobe
- KIRC:
-
Kidney renal clear cell carcinoma
- KIRC:
-
Kidney renal clear cell carcinoma
- KIRP:
-
Kidney renal papillary cell carcinoma
- LAML:
-
Acute myeloid leukemia
- LGG:
-
Brain lower grade glioma
- LGG:
-
Lower grade glioma
- LIHC:
-
Liver hepatocellular carcinoma
- LUAD:
-
Lung adenocarcinoma
- LUAD:
-
Lung adenocarcinoma
- LUSC:
-
Lung squamous cell carcinoma
- MESO:
-
Mesothelioma
- miRNA:
-
microRNA
- NCBI:
-
National center for biotechnology information
- OV:
-
Ovarian serous cystadenocarcinoma
- PAAD:
-
Pancreatic adenocarcinoma
- PCPG:
-
Pheochromocytoma and paraganglioma
- PRAD:
-
Prostate adenocarcinoma
- READ:
-
Rectum adenocarcinoma
- REST:
-
REpresentational State transfer
- RNA:
-
Ribonucleic acid
- SAM:
-
Sequence alignment/map
- SARC:
-
Sarcoma
- SKCM:
-
Skin cutaneous melanoma
- STAD:
-
Stomach adenocarcinoma
- TCGA:
-
The cancer genome atlas
- TGCT:
-
Testicular germ cell tumors
- THCA:
-
Thyroid carcinoma
- THYM:
-
Thymoma
- UCEC:
-
Uterine corpus endometrial carcinoma
- UCS:
-
Uterine carcinosarcoma
- UCSC:
-
University of California at Santa Cruz
- URL:
-
Uniform resource locator
- UUID:
-
Universally unique identifier
- UVM:
-
Uveal melanoma
- VCF:
-
Variant call format
- XML:
-
eXtensible markup language
References
Shendure J, Ji H. Next-generation DNA sequencing. Nat Biotechnol. 2008; 26(10):1135–45.
Meldrum C, Doyle MA, Tothill RW. Next-generation sequencing for cancer diagnostics: a practical perspective. Clin Biochem Rev. 2011; 32(4):177–95.
Koboldt DC, Steinberg KM, Larson DE, Wilson RK, Mardis ER. The next-generation sequencing revolution and its impact on genomics. Cell. 2013; 155(1):27–38.
Weitschek E, Santoni D, Fiscon G, De Cola MC, Bertolazzi P, Felici G. Next generation sequencing reads comparison with an alignment-free distance. BMC Res Notes. 2014; 7(1):869.
Hayden EC. Technology: the $1000 genome. Nature. 2014; 507(7492):294–5.
Sheridan C. Illumina claims $1000 genome win. Nat Biotechnol. 2014; 32(2):115.
Cumbo F, Fiscon G, Ceri S, Masseroli M, Weitschek E. Tcga2bed: extracting, extending, integrating, and querying the cancer genome atlas. BMC Bioinformatics. 2017; 18(1):6.
Ozsolak F, Milos PM. Rna sequencing: advances, challenges and opportunities. Nat Rev Genet. 2011; 12(2):87–98.
Pickrell JK, Marioni JC, Pai AA, Degner JF, Engelhardt BE, Nkadori E, Veyrieras J-B, Stephens M, Gilad Y, Pritchard JK. Understanding mechanisms underlying human gene expression variation with rna sequencing. Nature. 2010; 464(7289):768–72.
Weitschek E, Fiscon G, Fustaino V, Felici G, Bertolazzi P. Clustering and classification techniques for gene expression profile pattern analysis. Pattern Recognition in Computational Molecular Biology: Techniques and Approaches. Hoboken: Wiley; 2015. p. 347.
Hinkson IV, Davidsen TM, Klemm JD, Kerlavage AR, Kibbe WA. A comprehensive infrastructure for big data in cancer research: Accelerating cancer research and precision medicine. Frontiers Cell Dev Biol. 2017; 5:83.
Weinstein JN, Collisson EA, Mills GB, Shaw KRM, Ozenberger BA, Ellrott K, Shmulevich I, Sander C, Stuart JM, Network T. The cancer genome atlas pan-cancer analysis project. Nat Genet. 2013; 45(10):1113–20.
Jensen MA, Ferretti V, Grossman RL, Staudt LM. The nci genomic data commons as an engine for precision medicine. Blood. 2017; 130(4):453–459.
GDC Data Portal. https://gdc.cancer.gov/access-data/gdc-data-portal. Accessed 6 June 2018.
GDC Data Transfer Tool. https://gdc.cancer.gov/access-data/gdc-data-transfer-tool. Accessed 6 June 2018.
GDC Application Programming Interface (API). https://gdc.cancer.gov/developers/gdc-application-programming-interface-api. Accessed 6 June 2018.
Elloumi M, Iliopoulos C, Wang JT, Zomaya AY. Pattern Recognition in Computational Molecular Biology: Techniques and Approaches. Hoboken: Wiley; 2015.
Weitschek E, Felici G, Bertolazzi P. Clinical data mining: problems, pitfalls and solutions. In: Database and Expert Systems Applications (DEXA) 2013, 24th International Workshop on Biological Knowledge Discovery and Data Mining. Los Alamitos: IEEE: 2013. p. 90–94.
Tan P, Steinbach M, Kumar V. Introduction to Data Mining. Boston: Addison Wesley; 2005.
Weitschek E, Fiscon G, Felici G. Supervised DNA Barcodes species classification: analysis, comparisons and results. BioData Min. 2014; 7(1):1.
Weitschek E, Felici G, Bertolazzi P. MALA: a microarray clustering and classification software. In: Database and Expert Systems Applications (DEXA) 2012, 23rd International Workshop on Biological Knowledge Discovery and Data Mining. Los Alamitos: IEEE Computer Society: 2012. p. 201–5.
Saeed AI, Bhagabati NK, Braisted JC, Liang W, Sharov V, Howe EA, Li J, Thiagarajan M, White JA, Quackenbush J. [9] tm4 microarray software suite. Methods Enzymol. 2006; 411:134–93.
Reich M, Liefeld T, Gould J, Lerner J, Tamayo P, Mesirov JP. Genepattern 2.0. Nat Genet. 2006; 38(5):500–1.
Bertolazzi P, Felici G, Festa P, Fiscon G, Weitschek E. Integer programming models for feature selection: New extensions and a randomized solution algorithm. Eur J Oper Res. 2016; 250(2):389–99.
Cestarelli V, Fiscon G, Felici G, Bertolazzi P, Weitschek E. CAMUR: Knowledge extraction from RNA-seq cancer data through equivalent classification rules. Bioinformatics. 2016; 32(5):697–704.
Cohen WW. Fast effective rule induction. In: Proceedings of the Twelfth International Conference on Machine Learning. San Francisco: Morgan Kaufmann: 1995. p. 115–23.
Java Virtual Machine. https://www.java.com. Accessed 6 June 2018.
MySQL database management system. https://www.mysql.com. Accessed 6 June 2018.
Flicek P, Amode MR, Barrell D, Beal K, Brent S, Carvalho-Silva D, Clapham P, Coates G, Fairley S, Fitzgerald S, et al.Ensembl 2012. Nucleic Acids Res. 2011; 40(D1):84–90.
The Javascript programming language. https://www.javascript.com. Accessed 6 June 2018.
The NodeJs technology. https://nodejs.org. Accessed 6 June 2018.
The Express.js framework. http://expressjs.com/it. Accessed 6 June 2018.
JQuery javascript library. https://jquery.com. Accessed 6 June 2018.
Bootstrap HTML, CSS, and JS library. http://getbootstrap.com. Accessed 6 June 2018.
REmote DIctionary Server (Redis). https://redis.io. Accessed 6 June 2018.
Hanson MD. The client/server architecture. USA: Server Management, Auerbach Publications, CRC Press LLC; 2000. https://www.taylorfrancis.com/books/e/9781420031065.
Buschmann F, Henney K, Schimdt D. Pattern-oriented Software Architecture: on Patterns and Pattern Language vol. 5. Hoboken: Wiley; 2007.
Illumina Rna sequencing V2. www.illumina.com/products/by-type/sequencing-kits/library-prep-kits/truseq-rna-v2.html. Accessed 6 June 2018.
Mortazavi A, Williams BA, McCue K, Schaeffer L, Wold B. Mapping and quantifying mammalian transcriptomes by RNA-Seq. Nat Methods. 2008; 5(7):621–8.
Trapnell C, Williams BA, Pertea G, Mortazavi A, Kwan G, van Baren MJ, Salzberg SL, Wold BJ, Pachter L. Transcript assembly and quantification by rna-seq reveals unannotated transcripts and isoform switching during cell differentiation. Nat Biotechnol. 2010; 28(5):511–5.
Li B, Dewey CN. RSEM: accurate transcript quantification from RNA-Seq data with or without a reference genome. BMC Bioinformatics. 2011; 12(1):323.
Ludwig M-G, Seuwen K, Bridges JP. Adhesion gpcr function in pulmonary development and disease. In: Adhesion G Protein-coupled Receptors. New York: Springer: 2016. p. 309–327.
Uhlén M, Fagerberg L, Hallström BM, Lindskog C, Oksvold P, Mardinoglu A, Sivertsson Å, Kampf C, Sjöstedt E, Asplund A, et al. Tissue-based map of the human proteome. Science. 2015; 347(6220):1260419.
Gross AM, Kreisberg JF, Ideker T. Analysis of matched tumor and normal profiles reveals common transcriptional and epigenetic signals shared across cancer types. PLoS ONE. 2015; 10(11):0142618.
Liu R, Vaishnav RA, Roberts AM, Friedland RP. Humans have antibodies against a plant virus: evidence from tobacco mosaic virus. PLoS ONE. 2013; 8(4):60621.
Sigurdsson V, Ingthorsson S, Hilmarsdottir B, Gustafsdottir SM, Franzdottir SR, Arason AJ, Steingrimsson E, Magnusson MK, Gudjonsson T. Expression and functional role of sprouty-2 in breast morphogenesis. PLoS ONE. 2013; 8(4):60798.
Nakamura Y, Yasuoka H, Tsujimoto M, Yang Q, Imabun S, Nakahara M, Nakao K, Nakamura M, Mori I, Kakudo K. Prognostic significance of vascular endothelial growth factor d in breast carcinoma with long-term follow-up. Clin Cancer Res. 2003; 9(2):716–21.
Roscilli G, Cappelletti M, De Vitis C, Ciliberto G, Di Napoli A, Ruco L, Mancini R, Aurisicchio L. Circulating mmp11 and specific antibody immune response in breast and prostate cancer patients. J Transl Med. 2014; 12(1):54.
Barrett T, Edgar R. Gene expression omnibus: Microarray data storage, submission, retrieval, and analysis. Methods Enzymol. 2006; 411:352–69.
Acknowledgements
The results reported here are based upon the data generated by the TCGA Research Network: http://cancergenome.nih.gov/. We wish to thank Paolo Atzeni and Riccardo Torlone for supporting this work. Finally, we wish to thank Giulia Fiscon for reading the manuscript and for her precious suggestions.
Funding
All authors have been supported by the MoDiag Regione Lazio Project [grant number A0112-2016-13363] and publication charges have been paid from these funds. Additionally, P.B. has been supported by the MIUR grant“SysBioNet—Italian Roadmap for ESFRI Research Infrastructures” of the Sysbio Centre of Systems Biology, E.W. and E.C. by the ERC Advanced Grant GeCo (Datadriven Genomic Computing) [grant number 693174]. Finally, we wish to thank the Cineca consortium for assigning us supercomputer resources [grant number HP10CTJZAM] to make possible the big data calculations.
Availability of data and materials
The CamurWeb software and the knowledge repository is available at http://bioinformatics.iasi.cnr.it/camurweb/.
About this supplement
This article has been published as part of BMC Bioinformatics Volume 19 Supplement 10, 2018: Italian Society of Bioinformatics (BITS): Annual Meeting 2017. The full contents of the supplement are available online at https://bmcbioinformatics.biomedcentral.com/articles/supplements/volume-19-supplement-10.
Author information
Authors and Affiliations
Contributions
EW conceived and directed research. SDL implemented CamurWeb. SDL and EC performed data extraction, preparation, and classification analyses. EW conceived, supervised, and validated software design, development, and the experimentation. EW, SDL, and EC wrote the manuscript. PB and GF directed and funded research. All authors read and approved the final manuscript.
Corresponding author
Ethics declarations
Ethics approval and consent to participate
Not applicable (public data).
Consent for publication
Not applicable (public data).
Competing interests
The authors declare that they have no competing interests.
Publisher’s Note
Springer Nature remains neutral with regard to jurisdictional claims in published maps and institutional affiliations.
Rights and permissions
Open Access This article is distributed under the terms of the Creative Commons Attribution 4.0 International License (http://creativecommons.org/licenses/by/4.0/), which permits unrestricted use, distribution, and reproduction in any medium, provided you give appropriate credit to the original author(s) and the source, provide a link to the Creative Commons license, and indicate if changes were made. The Creative Commons Public Domain Dedication waiver (http://creativecommons.org/publicdomain/zero/1.0/) applies to the data made available in this article, unless otherwise stated.
About this article

Cite this article
Weitschek, E., Lauro, S.D., Cappelli, E. et al. CamurWeb: a classification software and a large knowledge base for gene expression data of cancer. BMC Bioinformatics 19 (Suppl 10), 354 (2018). https://doi.org/10.1186/s12859-018-2299-7
Published:
DOI: https://doi.org/10.1186/s12859-018-2299-7