- Software
- Open access
- Published:
PopMLvis: a tool for analysis and visualization of population structure using genotype data from genome-wide association studies
BMC Bioinformatics volume 25, Article number: 298 (2024)
Abstract
One of the aims of population genetics is to identify genetic differences/similarities among individuals of multiple ancestries. Many approaches including principal component analysis, clustering, and maximum likelihood techniques can be used to assign individuals to a given ancestry based on their genetic makeup. Although there are several tools that implement such algorithms, there is a lack of interactive visual platforms to run a variety of algorithms in one place. Therefore, we developed PopMLvis, a platform that offers an interactive environment to visualize genetic similarity data using several algorithms, and generate figures that can be easily integrated into scientific articles.
Introduction
Population structure can be inferred from Genome-Wide Association Study (GWAS) data and focuses on the genetic variation within and between populations by investigating the distributions of alleles and how their frequencies change over time [1]. Sophisticated algorithms implemented in standalone software are often used to infer population structure. A widely used tool is ADMIXTURE [2], which relies on maximum likelihood techniques [3]. Many of these software provide complementary results, but, to the best of our knowledge, there is a lack of a system that seamlessly visualizes the outputs of multiple software jointly. Another issue is that many softwares such as ADMIXTURE [2], FASTSTRUCTURE [3], STRUCTURE [4], and STRUCTURESELECTOR [5] rarely provide graphical outputs. Moreover, users cannot easily exploit existing additional related information (e.g., sex, disease status, known ancestry, etc.) while analyzing and interpreting their outputs like ClustVis [6].
Here, we considered all aforementioned drawbacks and developed an interactive platform, named PopMLvis, which carries out a wide range of tasks that a user may need to infer population structure using GWAS data. PopMLvis is flexible as: (1) It supports a variety of input datasets, i.e., raw genotype data, Principal Components (PCs), and admixture membership coefficient matrix; (2) It performs dimensionality reduction using Principal Component Analysis (PCA), t-Distributed Stochastic Neighbor Embedding (t-SNE), and PC-Air, which is a principlal component analysis that accounts for relatedness through the genetic relationship matrix (GRM) [7, 8]; (3) It performs various clustering algorithms (e.g., K-means and Hierarchical Clustering); (4) It detects outliers using Isolation Forest, OneClassSVM, and other metrics; (5) It offers an interactive and zoomable friendly graphical user interface; (6) It produces publication-ready figures in various types and resolutions. In addition, PopMLvis allows users to: (7) Download output files generated within PopMLvis with all required information that are ready for downstream analysis (e.g., association testing); (8) Link metadata with obtained clustering results; and (9) Integrate estimated genetic diversity indices generated by genetic structure programs (e.g., ADMIXTURE) and the clustering results. Since PopMLvis has a modular design, it is easy to add new modules (e.g., classification) or a new algorithm to the existing modules (e.g., uniform manifold approximation). PopMLvis is a secure web-based platform. Due to potential privacy concerns, we provide an offline version that can be installed locally. PopMLvis can be easily used without the need to write any script, which makes it more accessible to researchers.
Implementation
PopMLvis consists of three main panels, each with unique functionalities that the user can perform as depicted in Fig. 1.
-
1.
Input and Machine Learning (ML) Panel: This panel is composed of three modules:
-
Choose data: The first step, users can choose to use their own data, or example data, which is provided along with PopMLvis platform. Then, users can specify the type of data to upload, if they prefer to use their own data, which could be raw or processed data. For processed data, it includes PCA and/or admixture outputs (i.e., fraction of ancestral origins as obtained by admixture tools [2,3,4,5]. Data will be immediately reflected on the visualization panel after the upload. For raw data, it includes genotype data, GRM, projected dataset, and PCA. Here, the user can perform dimensionality reduction as well. Moreover, PopMLvis supports PCA, PC-Air, and t-SNE 2D and 3D. Also, t-SNE can be run on top of PCA results to visualize the data in a more reduced space.
-
Clustering algorithms module: This module includes the K-means, Fuzzy C-means, and Hierarchical Clustering algorithms. The Fuzzy C-means algorithm is suitable when admixture exists between individuals, and these individuals can belong to multiple clusters/ancestries.
-
Outlier detection module: PopMLvis integrates outlier detection algorithms based on statistical metrics (mean, standard deviation, and covariance matrix) and machine learning techniques such as OneClassSVM, Local Outlier Factor, and Isolation Forest.
-
-
2.
Visualization panel: This panel supports three interactive plot types: (1) Scatter plots: 1D, 2D, 3D, zoom in/out, legend and label naming, download, etc.; (2) Admixture bar charts: the user can investigate the estimated ancestral fraction for each individual with different certainty values; and finally, (3) Dendrograms to visualize the hierarchal clustering of the data. Scatter plots and admixture bar charts are linked together, so a change in one plot will be reflected in the other plot.
-
3.
Option panel: This panel provides the users with an option to include additional information on individuals such as sex, age, disease status, etc. This can be reflected on the plots with color/shape differences. The user has flexibility to define plot name, labels, resolution, etc. This makes the PopMLvis graphical outputs ready to be integrated in scientific articles.
Fig. 1 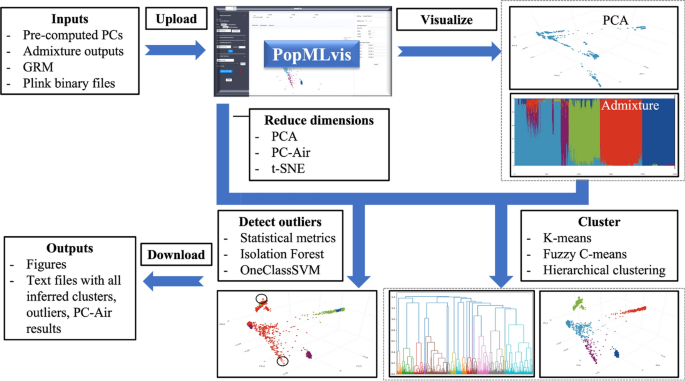
PopMLvis pipeline/workflow: (1) Upload and visualize PCA and Admixture results; (2) Dimensionality reduction: PCA, PC-Air, t-SNE 2D and 3D; (3) Clustering: K-means, Fuzzy C-means, and Hierarchical Clustering; (4) Detecting outliers: Isolation Forest, local Outlier Factor, and Statistical measures; and (5) Download graphical plots and datasheets

PopMLvis system architecture
The architecture of PopMLvis consists of three main components (see Fig. 2):
-
1.
Front-End: The front-end is built using ReactJS. React makes our data visualization attractive and efficient. All communication with the back-end is achieved through REST APIs, benefiting from promise based HTTP clients for the browser. The website is compatible with different screen sizes, making the visualization dynamic.
-
2.
Back-End: The back-end on the server side is served as a REST API and was developed using Flask. We used Gunicorn as a pre-fork worker model, where the master manages a set of workers. The number of workers corresponds with the number of concurrent requests that our back-end can handle. Gunicorn should only need 4–12 worker processes to handle hundreds or thousands of requests per second. Python was used for the machine learning and computational algorithms. Numpy, Pandas, Matplotlib, Scikit-learn and Scipy are among the libraries that were used. To integrate the PC-Air R package, we needed to add another layer of communication between Python and R. In this case, Flask would serve as a middle layer, serving the front-end request to R and waiting for its response, to send it back to the front-end.
-
3.
Data layer: PopMLvis can handle several types of data with various file extensions, including plink binary data (.bed,.fam,.bim), pre-computed PCA results, Genomic Relationship Matrix (GRM), and admixture results. Most of the data will never be stored on the server. It will be either encrypted inside the body of the request using HTTPS protocol, or used only on the front-end. The choose data tab will keep the data in the front-end only. When settings change, no requests will be made to the back-end. The clustering algorithms and outlier detection modules require the data to be sent to the back-end for computation, but results will be returned back to the user without storing or keeping any trace of it. Because of various encryptions and file extensions, the dimensionality reduction uploads are stored locally with encrypted filenames, processed, and results are communicated to the user. All gathered data will be cleaned through a job scheduler, CRON.

PopMLvis schematic architecture
Conclusion
We developed PopMLvis, an interactive tool that supports many useful features for researchers to analyze and visualize population structure using genotype data. Our user-friendly platform offers important functionalities including: supporting a variety of input datasets, interactive visualization, performing dimensionality reduction, clustering, and outlier detection. In addition, for privacy purposes, we developed a web-based as well as a standalone version of the platform.
Methods
PopMLvis data types
PopMLvis supports different types of input datasets. This gives more flexibility to users on how this tool can be used.
-
Genome-wide association study data: This is the standard dataset that is used to test the association between genetic variables and disease of interest. The data contains genotypes of subjects and is highly dimensional (thousands of Single Nucleotide Polymorphisms (SNPs) and subjects).
-
Correlation/Kinship matrix data: This dataset is NxN dimension, where N represents the number of subjects. It contains the genetic correlation/ kinship between all pairs of subjects.
-
Principal component analysis data: These are pre-computed principal components by the user using genotype data or other types of data.
-
Admixture data: This dataset is the result of ADMIXTURE (or similar tools/models), which contains the admixture fractions of subjects across a predefined number of clusters.
PopMLvis data format
PopMLvis accepts multiple file formats:
-
Comma Separated Value (CSV) file: Common, space, or tab-delimited input files are accepted. Headers are required and can include:
IID: it represents the ID of a single individual.
PC1: the 1st Principal Component
PC2: the 2nd Principal Component.
PCN: the Nth Principal Component
Metadata information: These are extra columns that could be included in the dataset (e.g., Ancestry, Age, Sex, Phenotype status, SNPs, etc.).
-
GWAS data: This is the binary plink format. Three files are required: .bed, .bim, and .fam. In addition, if users want to run PC-Air, they should provide a correlation/kinship matrix of all pairs of individuals (space- or comma-delimited). This can be computed by many tools such as plink, GCTA, KING, etc. If the kinship matrix is not provided, PopMLvis uses the identity matrix by default.
-
Pickle file: It is a binary format that can be used to store genetic datasets, including metadata fields. Pickle is used internally by python to serialize objects. It is a faster and more flexible format. However, it is not supported by many programs (applications/softwares).
Note that many kinship calculators provide outputs in a long format, e.g., in the case of GCTA [9], the output looks as follows:
-
IID1 IID1 Kinship1
-
IID1 IID2 Kinship2
-
IID1 IID3 Kinship3
-
etc.
To convert it to our matrix format, users can use the following code in R:

Projections (dimensionality reduction algorithms)
PopMLvis supports multiple dimensionality reduction algorithms, which help visualize the latent structure in GWAS dataset:
-
Principal components analysis (PCA): principal components analysis is a traditional, well-known, and most used linear transformation technique to visualize the genetic diversity in a dataset. It focuses on capturing the direction of maximum variation in a dataset through these principal components.
-
Principal components analysis accounting for relatedness between subjects (PC-Air): It is used to perform a principal components analysis using genome-wide SNP data for the detection of population structure in a sample. Unlike the standard PCA, PC-Air accounts for sample relatedness (known or cryptic) to provide accurate ancestry inference that is not confounded by family structure.
-
Linear Discriminant analysis (LDA): It is a linear transformation technique, like PCA, to find a linear combination of features that best explain the GWAS dataset. It could be categorized as a supervised dimensionality reduction technique, which could be exploited in classifying the dataset simultaneously.
-
t-Distributed Stochastic Neighbor Embedding (t-SNE): It is a non-linear transformation technique that is well-suited for embedding high-dimensional data for visualization in a low-dimensional space of two or three dimensions. It tries to preserve the local structure (cluster) of genetic data and capture outliers simultaneously.
Clustering algorithms
-
K-means: It is one of the most popular clustering algorithms. It stores k-centroids, which are used to define the clusters (ancestry groups). Then, each data point, which represents an individual, is assigned to the nearest cluster centroid. After that, it calculates the means (updated centroids) of data points in each cluster. This process is repeated until the assignment of data points no longer changes, which means that each subject is assigned to a given cluster (e.g., ancestry group).
-
Fuzzy c-means: It is similar to K-means, but instead of assigning each data point (i.e., individual) to only one cluster, each data point can belong to many clusters with a weighting percentage. The weighting percentage increases if data points are close to the cluster centroid and decreases if they are far from the centroids.
-
Hierarchical clustering: The general strategy is to follow a bottom-up approach “agglomerative”, where each data point starts in its cluster and pairs of clusters are merged as one moves up the hierarchy. We end up having only one cluster for the whole genotype dataset. Then, based on the user’s decision of how dissimilar clusters should be; a threshold value is applied. A dendrogram “tree-like” is the commonly used representation for hierarchical clustering.
Admixture analysis
ADMIXTURE software: It is one of the widely used admixture algorithms to estimate ancestry fractions of each subject. This is a supervised approach, where a predefined number of clusters should be selected by users before running Admixture.
Outlier detection
PopMLvis provides multiple outlier detection techniques to flag subjects that could be excluded from downstream analysis:
-
Statistical metrics: Using principal components (PCs), deviation from the mean (µ) is used to detect outliers (µ ± 3σ, µ ± 2σ, etc.), where σ is the standard deviation. Users can define the list of PCs and the standard deviation threshold that can be used for outlier detection (µ ± 3σ on PC1 and PC2; µ ± 3σ on PC1 or PC2; etc.).
-
Isolation Forest: This method identifies anomalies by isolating outliers in the data. It is based on a decision-tree algorithm, where it recursively generates partitions on the dataset by randomly selecting a feature and then randomly selecting a split value for the feature (e.g., PC).
-
Minimum Covariance Determinant: It estimates the mean and covariance matrix for each subset in the data. Then, it keeps the estimates for the subset whose covariance matrix has the smallest determinant (the most tightly distributed).
-
Local Outlier Factor: The anomaly score of each sample is called the Local Outlier Factor. It measures the local deviation of the density for a given sample with respect to its neighbors, where the locality is given by k-nearest neighbors, whose distance is used to estimate the local density.
-
OneClassSVM: It is a variation of the SVM classification algorithm. The algorithm is modeled as one class, which permits the algorithm to capture the density of the majority class and classifies examples on the extremes of the density function as outliers.
Visualization
Main dashboard: The main window of PopMLvis overviews all components of the application.
As can be seen in Fig. 3, the primary PopMLvis dashboard can be categorized into four panels:
-
Choose data: We designed this panel in an interactive manner with the user. The users has the choice to either upload their dataset, or utilize the provided datasets. This panel also provides the user freedom to choose the dataset type they want, between the PCA data and/or Admixture results.
For the datasets, we provided two sample datasets: 1000 Genomes Project (1KG) and Human Genome Diversity Project (HGDP) that can be utilized. There is a separate visualization for PCA and ADMIXTURE components (see Fig. 4).
Fig. 3 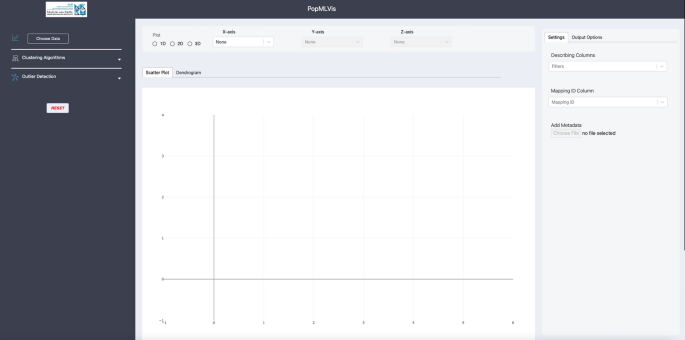
The main window of PopMLvis
Fig. 4 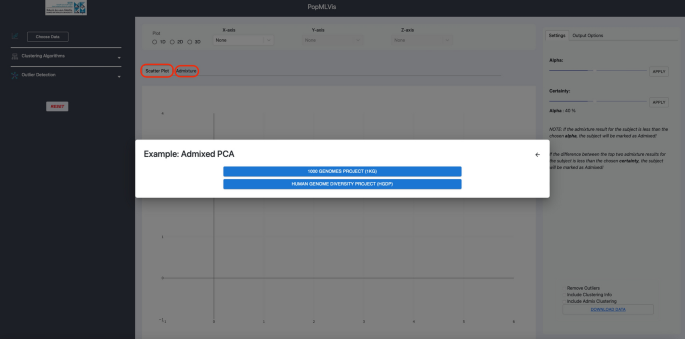
Input panel of PopMLvis
-
PCA and Admixture: It is the combination of the PCA data and the Admixture results. ADMIXTURE will try to cluster the data based on their ancestry, and the output will be a set of probabilities p1, p2, .. pn where n is the number of clusters.
-
We say a subject si belongs to cluster k, if
-
pk = max (p1, p2, … pk, …, pn) and pk > alpha; or
-
pk = max (p1, p2, … pk, …, pn), and pk - pj > certainty,
where pj = max (p1, p2, … pk-1, pk+1, …, pn), i.e. the second largest probability.
- Here, alpha is a regularization parameter that penalizes intermediate ancestry proportions, whereas certianty is how certain an individual belongs to specific ancestry.
- The visualization result is a scatter plot and a bar plot (see Fig. 5).
Fig. 5 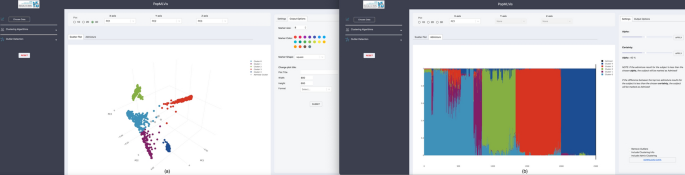
a The effect of alpha and certainty in PCA scatter plot and, b The effect of alpha and certainty in Admixture bar plot
In the scatter plot, each subject is colored by the dominant cluster assigned by admixture, based on alpha/certainty. The greyed out subjects are admixed (see Fig. 5a).
In the bar plot, each bar of height 100% corresponds to one subject, where the stacked colors describe the genetic component proportions of the subject. The greyed out subjects are admixed (see Fig. 5b).
-
-
-
Dimensionality Reduction: If the input data consists of a large number of features, PopMLvis is compatible with performing dimensionality reduction algorithms.
As shown in Fig. 6, PopMLvis supports four dimensionality reduction algorithms to make it possible for the user to analyze high dimensional data more efficiently.
Fig. 6 
Four different examples of dimensionality reduction algorithms. a PCA (expected input: Correlation Matrix/Genetic Relationship Matrix). b PC-Air (expected input: PLINK files, optional: Kinship). c t-SNE 2D (using PCA data). d t-SNE 3D (using PCA data)
All the options have an expected data type input.
-
PCA
-
a.
Expected input: Correlation Matrix (NxN).
-
b.
Output: Low Dimensional Data (Nxk, where k is defined by the user).
-
a.
-
-
PC-Air:
-
a.
Expected input:
i. bed (PLINK binary biallelic genotype table).
ii. bim (PLINK extended MAP file).
iii. fam (PLINK sample information file).
iv. Kinship (optional): A symmetric matrix of pairwise kinship coefficients for every pair of individuals in the sample. If the kinship matrix is not provided, the result will be a usual PCA.
-
b.
Output: Low Dimensional Data (Nxk, where k is defined by the user).
-
a.
-
t-SNE 2D:
-
a.
Expected input: PCA data or Correlation Matrix/GRM.
-
b.
Output: 2D data, see Fig. 7.
Fig. 7: 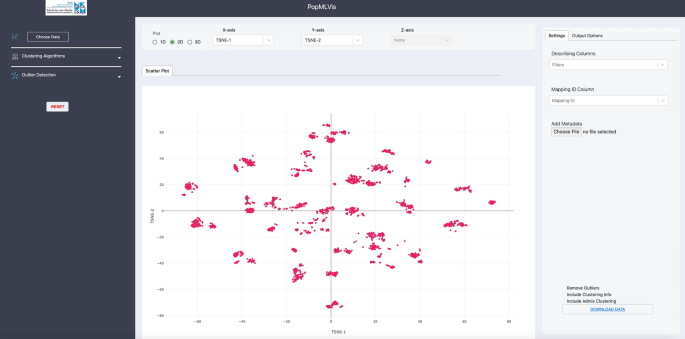
2D dimensionality reduction of 1000 Genomes Project.
-
a.
-
t-SNE 3D
-
a.
Expected input: PCA data or Correlation Matrix/GRM.
-
b.
Output: 3D data, see Fig. 8.
-
Visualization panel: This panel provides the user with different options to choose from in terms of the number of dimensions (1D, 2D, or 3D) and which principal components to be viewed (see Fig. 9).
-
Clustering panel: This panel allows the user to apply a variety of clustering algorithms to the uploaded dataset and visualizes the results spontaneously. For each algorithm, the user can set the parameters such as the number of clusters (see Fig. 10).
-
Outlier detection panel: The user can specify which principal component they want to remove outliers from, and it is up to the user to choose more than one principal component. Also, the user can select if he/she wants to do “AND” or “OR” operations when there is more than one principal component. Moreover, the user has to decide the deviation from the mean (μ) to be flagged as an outlier (e.g., 1SD, 2SD, etc.) as shown in Fig. 11.
Fig. 8: 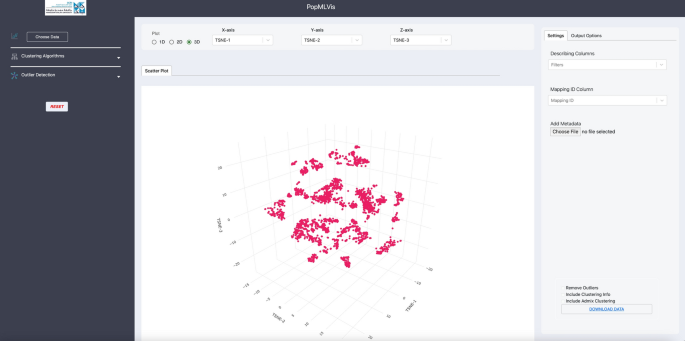
3D dimensionality reduction of 1000 Genomes Project
Fig. 9 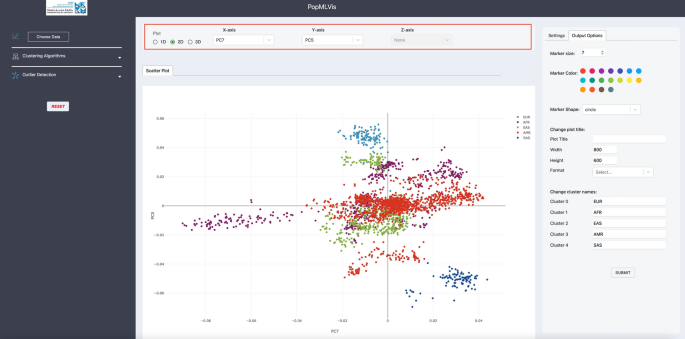
Viewing the principal components
Fig. 10 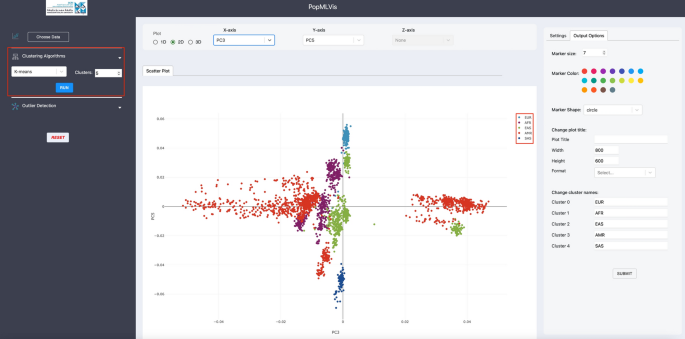
Clustering algorithms panel
Fig. 11 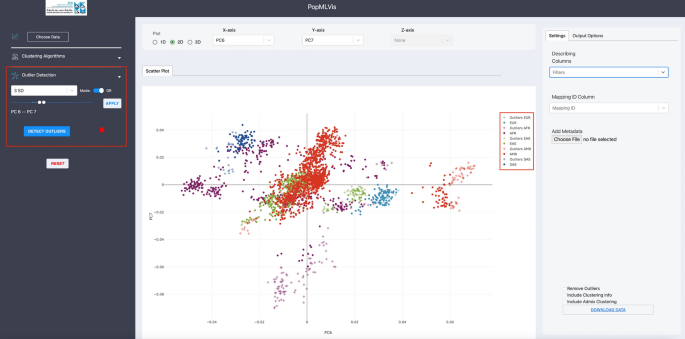
Outlier detection panel
-
-
a.


Exporting outputs
After performing the required operations, the user can export the output in a csv file. As you can see in Fig. 12, the user can download the data with the following options:
-
Removing outliers: As shown in Fig. 13a, the user can exclude outlier samples.
-
Include clustering information: As depicted in Fig. 13b, the user can add clustering information to the exported dataset.
-
Include Admix clustering: As depicted in Fig. 13c, the user can add Admix clustering data to the exported dataset.

Download data panel

a Data excluding outliers. b Including cluster information, and c Including Admix clustering information
Data availability
PopMLvis is freely available and can be accessed online at https://popmlvis.qcri.org. For data privacy issues, the source code of PopMLvis can be downloaded and installed from the GitHub repository https://github.com/qcri/QCAI-PopMLVis. The user manual and tutorial can be found online at the PopMLvis website.
References
McCandlish DM, Stoltzfus A. Modeling evolution using the probability of fixation: history and implications. Q Rev Biol. 2014;89(3):225–52.
Alexander DH, Novembre J, Lange K. Fast model-based estimation of ancestry in unrelated individuals. Genome Res. 2009;19(9):1655–64.
Pritchard JK, Stephens M, Donnelly P. Inference of population structure using multilocus genotype data. Genetics. 2000;155(2):945–59.
Raj A, Stephens M, Pritchard JK. fastSTRUCTURE: variational inference of population structure in large SNP data sets. Genetics. 2014;197(2):573–89.
Li YL, Liu JX. StructureSelector: a web-based software to select and visualize the optimal number of clusters using multiple methods. Mol Ecol Resour. 2018;18(1):176–7.
Metsalu T, Vilo J. ClustVis: a web tool for visualizing clustering of multivariate data using Principal Component Analysis and heatmap. Nucleic Acids Res. 2015;43(W1):W566–70.
Conomos MP, Miller MB, Thornton TA. Robust inference of population structure for ancestry prediction and correction of stratification in the presence of relatedness. Genet Epidemiol. 2015;39(4):276–93.
Gogarten SM, Sofer T, Chen H, Yu C, Brody JA, Thornton TA, Rice KM, Conomos MP. Genetic association testing using the GENESIS R/Bioconductor package. Bioinformatics. 2019;35(24):5346–8.
Yang J, Lee SH, Goddard ME, Visscher PM. GCTA: a tool for genome-wide complex trait analysis. Am J Hum Genet. 2011;88:76–82. https://doi.org/10.1016/j.ajhg.2010.11.011.
Funding
Authors are funded by the Qatar Computing Research Institute. No external funding was received.
Author information
Authors and Affiliations
Contributions
M.E. and M.S. conceived the study. M.E., K.I. and K. K. built the system. M.S. provided the 1000 Genomes Project and Human Genome Diversity Project datasets. M.E., K. I. and M.S. performed the analysis. M.E., K.I. and M.S. drafted the manuscript. M.E., K.I., K.K., and M.S. revised the manuscript and approved it. All authors tested the system. M.E. and M.S. coordinated the study.
Corresponding authors
Ethics declarations
Ethics approval and consent to participate
N/A.
Availability and requirements
Project name: PopMLvis, Project home page: https://popmlvis.qcri.org, Operating system(s): Platform independent (PopMLvis is supported on Windows, macOS, and Linux operating systems), Programming language: Python, C + + , R, and Flask, Other requirements: Python 3.9 or higher, License: MIT license, Any restrictions to use by non-academics: licence needed.
Competing interests
All authors declare no conflict of interest.
Additional information
Publisher's Note
Springer Nature remains neutral with regard to jurisdictional claims in published maps and institutional affiliations.
Supplementary Information
Rights and permissions
Open Access This article is licensed under a Creative Commons Attribution-NonCommercial-NoDerivatives 4.0 International License, which permits any non-commercial use, sharing, distribution and reproduction in any medium or format, as long as you give appropriate credit to the original author(s) and the source, provide a link to the Creative Commons licence, and indicate if you modified the licensed material. You do not have permission under this licence to share adapted material derived from this article or parts of it. The images or other third party material in this article are included in the article’s Creative Commons licence, unless indicated otherwise in a credit line to the material. If material is not included in the article’s Creative Commons licence and your intended use is not permitted by statutory regulation or exceeds the permitted use, you will need to obtain permission directly from the copyright holder. To view a copy of this licence, visit http://creativecommons.org/licenses/by-nc-nd/4.0/.
About this article

Cite this article
Elshrif, M., Isufaj, K., Kunji, K. et al. PopMLvis: a tool for analysis and visualization of population structure using genotype data from genome-wide association studies. BMC Bioinformatics 25, 298 (2024). https://doi.org/10.1186/s12859-024-05908-1
Received:
Accepted:
Published:
DOI: https://doi.org/10.1186/s12859-024-05908-1