- Research
- Open access
- Published:
PredictiveNetwork: predictive gene network estimation with application to gastric cancer drug response-predictive network analysis
BMC Bioinformatics volume 23, Article number: 342 (2022)
Abstract
Background
Gene regulatory networks have garnered a large amount of attention to understand disease mechanisms caused by complex molecular network interactions. These networks have been applied to predict specific clinical characteristics, e.g., cancer, pathogenicity, and anti-cancer drug sensitivity. However, in most previous studies using network-based prediction, the gene networks were estimated first, and predicted clinical characteristics based on pre-estimated networks. Thus, the estimated networks cannot describe clinical characteristic-specific gene regulatory systems. Furthermore, existing computational methods were developed from algorithmic and mathematics viewpoints, without considering network biology.
Results
To effectively predict clinical characteristics and estimate gene networks that provide critical insights into understanding the biological mechanisms involved in a clinical characteristic, we propose a novel strategy for predictive gene network estimation. The proposed strategy simultaneously performs gene network estimation and prediction of the clinical characteristic. In this strategy, the gene network is estimated with minimal network estimation and prediction errors. We incorporate network biology by assuming that neighboring genes in a network have similar biological functions, while hub genes play key roles in biological processes. Thus, the proposed method provides interpretable prediction results and enables us to uncover biologically reliable marker identification. Monte Carlo simulations shows the effectiveness of our method for feature selection in gene estimation and prediction with excellent prediction accuracy. We applied the proposed strategy to construct gastric cancer drug-responsive networks.
Conclusion
We identified gastric drug response predictive markers and drug sensitivity/resistance-specific markers, AKR1B10, AKR1C3, ANXA10, and ZNF165, based on GDSC data analysis. Our results for identifying drug sensitive and resistant specific molecular interplay are strongly supported by previous studies. We expect that the proposed strategy will be a useful tool for uncovering crucial molecular interactions involved a specific biological mechanism, such as cancer progression or acquired drug resistance.
Background
Gene networks are crucial for understanding complex disease mechanisms because the molecular mechanisms involved in disease are related to abnormalities in complex molecular networks, rather than in a single gene. To estimate gene regulatory networks, various computational strategies have been proposed and used to identify the molecular interplay involved in specific biological processes (e.g., cancer progression or anti-cancer drug sensitivity). Estimated gene networks have been applied to uncover complex disease mechanisms and identify drug-response marker. Importantly, the effectiveness of network-based analysis has been validated [1, 2]. The gene regulatory network has been also applied to predict a specific clinical characteristic, e.g., cancer prediction, pathogenicity prediction, where the network is used as an input of prediction model [3,4,5]. In recent years, predicting drug sensitivity and understanding the molecular mechanisms related to drug resistance in cancer cells has drawn a large amount of attention. Several studies predicted drug sensitivity based on gene networks, e.g., protein-protein interaction (PPI) networks or prior knowledge networks [6,7,8].
Although several computational strategies have been developed for network-based prediction, existing studies estimate gene networks first, and predict a specific clinical characteristic based on pre-estimated networks. Thus, we cannot identify the gene regulatory system characteristics that are related to a specific clinical characteristic (i.e., the object of prediction). Furthermore, existing studies focus only on algorithmic and statistical performance and develop prediction strategies purely from mathematical and computational viewpoints without considering network biology. This leads to difficulty when interpreting the prediction results and when identifying biomarkers.
To address this issue, we propose a novel statistical strategy called a PredictiveNetwork. We consider the response variable-predictive gene network estimation, where the response variable is a specific clinical characteristic. PredictiveNetwork performs loss-of-function analysis for gene network estimation and prediction. The objective function of PredictiveNetwork consists of loss functions for gene network estimation and prediction, and thus the gene network estimation and prediction are simultaneously performed. In our strategy, the gene network is estimated by minimizing the losses of estimating gene regulatory systems and response variable prediction, and thus we can uncover prediction specific gene regulatory system, i.e., a prediction-specific gene regulatory network for a clinical characteristic. Furthermore, we incorporate knowledge of network biology into the statistical prediction model based on the network constraint \(L_{1}\)-type regularization, as described in [9, 10]. Genes linked within networks/pathways may have similar biological functions, while hub genes, which interact with many other genes, are crucial markers that play key roles in gene regulation and biological processes [11]. In our strategy, differences in coefficients for neighboring genes in the network are smoothed, followed by simultaneous selection of the related genes. We also encourage that hub genes would have large coefficients and/or would be easily selected in the prediction model. In short, the prediction model is constructed based on crucial subnetworks consisting of hub genes and their target/regulator genes. Thus, we can perform biologically reliable interpretation of the prediction results based on molecular interplay in the subnetwork and reliably identify biomarkers (e.g., uncovering crucial genes and molecular interactions involved in a specific biological process).
We demonstrate the effectiveness of the PredictiveNetwork for prediction and feature selection accuracies in the prediction model and edge selection accuracies in gene network estimation using Monte Carlo simulations. We also applied our strategy to the Sanger Genomics of Drug Sensitivity in Cancer (GDSC) dataset from the Cancer Genome Project to construct drug response-predictive gene network. We performed drug sensitivity prediction and sensitivity-predictive gene network analysis for the FDA-approved gastric cancer drugs, doxorubicin, mitomycin-c, 5-Fluorouracil (5-FU), and docetaxel. Our strategy shows effective prediction results for mitomycin-c, 5-Fluorouracil, and docetaxel sensitivity. Then, we identified predictive drug response markers and characteristics of the associated regulatory systems in drug-sensitive and -resistant cell lines. More than half of the identified gastric cancer drug response markers have strong evidences as biomarkers for gastric cancer and anti-cancer drug responses. In particular, the identified AKR family (AKR1C1, AKR1C3, AKR1B10) are likely anti-cancer drug resistance markers. We identified AKR1C3 and AKR1B10 as having drug resistance characteristics and that their hubness becomes significantly smaller in drug-resistant compared to drug-sensitive cell lines. For the drug sensitive cell lines, activities of ANXA10 and ZNF165 are identified as characteristics and the hubness of ANXA10 in drug-sensitive cell lines is strongly supported by previous studies. Further, ZNF165 may be a novel marker of gastric cancer drug responsiveness. Our results of GDSC data analysis suggest that the molecular interplay between genes of the AKR family, rather than single genes alone, plays key roles in acquired gastric cancer drug resistance. Thus, suppressors of AKR family genes and inducers of ANXA10/ZNF165 may reduce drug resistance of cancer cell lines.
The remainder of this paper is organized as follows: In the “Method” section, we propose a novel strategy for predictive gene network estimation and then describe the numerical solution of the PredictiveNetwork. Then, we show the results of simulation studies in the “Monte Carlo simulations” section. Finally, we describe the results of gastric cancer drug response-predictive gene network analysis. Conclusions are provided in the “Discussion” section.
Method
Suppose \({\varvec{X}}=({\varvec{x}}_{1},...,{\varvec{x}}_{n})^{T} \in {\mathbb {R}}^{n\times p}\) is an \(n \times p\) data matrix describing the expression of p possible regulators that control target gene transcription \({\varvec{y}}_{j} \in {\mathbb {R}}^{n}, j=1,...,k\). Consider the linear regression model,
where \(\beta _{jl}\) is the regression coefficient that represents the effect of each regulator \({\varvec{x}}_{j}\) on its target \({\varvec{y}}_{j}\) and \(\varvec{\epsilon }_{j}=(\epsilon _{j1},...,\epsilon _{jn})^{T}\) is a random error vector that is assumed to be independently and identically distributed with mean 0 and variance \(\sigma ^{2}_{y}\).
Gene regulatory networks are often estimated using the following \(L_{1}\)-type regularization methods (e.g., lasso, elastic net, fused lasso, etc.) [12,13,14],
where
and \(\lambda _1, \lambda _2>0\) are the regularization parameters of \(\varvec{\beta }\).
Although several statistical methods were developed for network-based prediction models, previous studies performed network estimation and prediction separately, i.e. the gene network was constructed first and then the estimated network was used as the prediction model input [6,7,8]. Furthermore, existing prediction models were developed purely from an algorithmic and statistical point of view, without considering network biology. Thus, the existing methods cannot provide effective interpretation of the prediction results, which causes difficulty in reliable biomarker identification.
Predictive gene regulatory network estimation
To effectively predict a specific biological mechanism and gene networks estimation that provides critical insights into understanding biological mechanisms, we propose a novel statistical method, called a PredictiveNetwork.
Suppose we have n independent observations for the response variables \({\varvec{z}}=({z_{1},...,z_{n}})^{T}\). We consider response variable-predictive gene network estimation and propose a novel model that enables us to simultaneously estimate gene network and predict the response variable,
where \(\theta _{0}\) is an intercept, \(\varvec{\theta }=(\theta _{1},...,\theta _{k})^{T}\) is a coefficient vector of gene expression levels for the response variable \({\varvec{z}}\), \({\varvec{B}}=(\varvec{\beta }_{1},...,\varvec{\beta }_{k})\) is a \(p \times k\) matrix describing regulatory systems between genes in the directional network, and \(\lambda _{3}>0\) is a regularization parameter to impose sparsity on \(\varvec{\theta }\) in the prediction model. The first term in (3) indicates the loss function for the prediction of a response variable based on the gene network and the second term is the loss function of gene network estimation.
In the proposed method, the regularity system between genes \({\varvec{B}}\) is estimated to minimize errors for both network estimation and prediction. In other words, our method can provide prediction-specific network estimation results. Thus, we can identify crucial information for understanding biological mechanisms (i.e., response variables in the prediction model) based on the estimated network.
To achieve more biologically interpretable prediction results, we incorporate network biology into the prediction model using network constraint regularization [9, 10]. The estimated network from the second term in (3) can be represented by a weighted graph \(G=(V,E,W)\), where \(V=\{1,...,p\}\) is the set of vertices corresponding to p genes and \(E \in V \times V\) is the set of edges. (i, j) indicates a link between vertices i and j (i.e., genes i and j) and \(W=(w_{ij}), (i,j) \in E\) is the edge weight. The normalized Laplacian matrix \({\varvec{L}}\) for the graph is given as G [9, 10],
where \(d_{i}\) is the degree of each gene, which is given as \(d_{i}=\sum _{i\sim j}^{w_{ij}}\).
In our method, the effect of regulators on their target genes are estimated in \({\varvec{B}}\), where the rows and columns of \({\varvec{B}}\) indicate the regulator and target gene, respectively. Thus, we compute \({\varvec{W}}=w_{ij}\) based of effect of the ith gene to jth gene (i.e., \(B_{ij}\)) and the jth gene to ith gene (i.e., \(B_{ji}\))as follows,
We describe the estimated gene network based on the Laplacian matrix and incorporate the estimated network into the prediction model based on \({\varvec{L}}\). We then propose PredictiveNetwork as follows,
where \({\varvec{L}}^{a}={\varvec{S}}^{T}{\varvec{L}}{\varvec{S}}\) with \({\varvec{S}}=\text {diag}(\text {sgn}({\hat{\theta }}_{1}),...,\text {sgn}({\hat{\theta }}_{k}))\). The last term in (6) penalizes the differences of the scaled coefficients between the neighboring genes in the network. From the following local quadratic approximation of \(L_{1}\)-type penalty [15],
the last term in (6) can be represented as [10]
The genes linked in the networks may have similar biological functions. Thus, we encourage similarity in gene coefficients in the prediction model by using the network constrained penalty. The penalty term enables us to locally smooth the network and encourage the simultaneous selection of related variables, even though neighboring genes have opposite coefficient signs. The hub genes that have many interactions with other genes play a key role in gene regulation and biological processes [11], and thus are crucial markers to understand specific biological mechanisms. In our model, a relatively small penalty is imposed on the hub genes of the estimated networks by re-scaling the coefficients with the square root of the degrees. This scaling causes the hub genes and their regulator/target genes to have relatively large coefficients and/or be easily selected by penalties on the coefficients between neighboring genes. Thus, our method constructs the prediction model based on crucial sub networks, which leads to effective interpretation of the prediction results and predictive marker identification using network biology.
In our model, the gene network described by \({\varvec{B}}\) is estimated to minimize error for not only network estimation but also prediction. It implies that the network is estimated to be optimized for explain the response variable \({\varvec{z}}\). Thus, we can effectively uncover the biological mechanism for the response variable based on the estimated gene regulatory network. Furthermore, the coefficient \(\varvec{\theta }\) explains the change in a response variable as changes of the effect of \(l^{th}\) regulator gene on \(j^{th}\) target gene (i.e., \({\varvec{x}}_{l}{\hat{\beta }}_{jl}\)). That is, the change in specific-biological characteristics (e.g., drug sensitivity of cell lines) is explained by the regulatory system between genes. In short, we can interpret the complex mechanism of disease based on not a single gene but molecular interplays between genes, and it leads to biologically reliable interpretation.
Implementation
To simultaneously perform prediction and gene network estimation, we adapted the following coordinate descent algorithm for estimating \({\varvec{B}}\) and \(\varvec{\theta }\) [16, 17].
- Step 1.:
-
The optimization of \(\beta _{jl}\) in (6), given \(\varvec{\theta }\) and \(\theta _{0}\) has the following solution,
$$\begin{aligned} {\hat{\beta }}_{jl}\leftarrow \frac{S(\sum _{i=1}^{n}x_{il}\{\theta _{j}(z_{i}-z_{i}^{(jl)})+(y_{ij}-y^{(l)}_{ij})\}, \frac{1}{2}\lambda _{1})}{\sum _{i=1}^{n}x^{2}_{il}(\theta ^{2}_{j}+1)+\lambda _{2}}\quad l=1,...,p;\quad j=1,...,k, \end{aligned}$$(9)where
$$\begin{aligned}&z^{(jl)}_{i}=\theta _{0}+\sum _{j=1}^{k}\sum _{r\ne l}\theta _{j}\beta _{jr}x_{ir}+\sum _{g\ne j}\theta _{g}\beta _{gl}x_{il},\quad j=1,...,k\\&y^{(l)}_{ij}=\sum _{r \ne l}\beta _{jr}x_{ir}, \end{aligned}$$and \(S(\theta ,\lambda )\) is a soft thresholding operator with value
$$\begin{aligned} S(\theta ,\lambda )= {\left\{ \begin{array}{ll} \theta -\lambda &{} \text {if } \theta >0 \text { and } \lambda<|\theta |,\\ \theta +\lambda &{} \text {if } \theta<0 \text { and } \lambda <|\theta |,\\ 0 &{} \text {if } \lambda \ge |\theta |.\\ \end{array}\right. } \end{aligned}$$(10) - Step 2.:
-
We then compute \({\varvec{W}}\) and \({\varvec{L}}\) based on (4) and (5). The coordinate-wise update of \(\theta _{j}\) given \({\varvec{B}}\), \({\varvec{L}}\), and \(\theta _{0}\) has the following form,
$$\begin{aligned} {\hat{\theta }}_{j}&\leftarrow \frac{S(\sum _{i=1}^{n}\varvec{\beta }^{T}_{j}{\varvec{x}}_{i}(z_{i}-z^{(j)}_{i})-\lambda _{4}\sum _{q \ne j}l^{a}_{qj}\theta _{q},\frac{\lambda _{3}}{2})}{\sum _{i=1}^{n}(\varvec{\beta }^{T}_{j}{\varvec{x}}_{i})^{2}+\lambda _{4}L^{a}_{jj}}, \end{aligned}$$(11)where \(z^{(j)}_{i}=\theta _{0}+\sum _{g\ne j}\theta _{g}\varvec{\beta }^{T}_{g}{\varvec{x}}_{i}\).
- Step 3.:
-
The estimate of \(\theta _{0}\) given \({\varvec{B}}\) and \(\varvec{\theta }\) is given as
$$\begin{aligned} {\hat{\theta }}_{0}=\frac{1}{n}\sum _{i=1}^{n}\left( z_{i}-\sum _{j=1}^{k}\theta _{j}\sum _{l=1}^{p}\beta _{jl}x_{il}\right) . \end{aligned}$$(12) - Step 4.:
-
Finally, we update the parameters \(\hat{{\varvec{B}}}, \hat{\varvec{\theta }}, \hat{\theta _{0}}\) cyclically until convergence.
Covariance updates for computational efficiency
The proposed method updates \(\varvec{\theta }\) for p variables and \(\beta _{jl}\) for \(p \times k\) variables, simultaneously. This implies that the PredictiveNetwork suffers from computational complexity. Since gene expression data usually consists of a large number of features, the predictive gene network estimation requires a huge computational complexity. To reduce this computational complexity, we considered covariance updates [16].
The coordinate update of \({\varvec{B}}\) in (9) can be rewritten as follows:
where \({\tilde{\beta }}_{jl}\) is the estimate of \(\beta _{jl}\) obtained from the previous update, \(r^{z}_{i}=z_{i}-\theta _{0}-\sum _{j=1}^{k}\sum _{r=1}^{p}\theta _{j}{\tilde{\beta }}_{jr}x_{ir}\), and \(r^{y}_{ij}=y_{ij}-\sum _{r=1}^{p}{\tilde{\beta }}_{jr}x_{il}\). The second term of (13) can be represented
and the third term is given as
This implies that only the last terms of (14) and (15) are updated for \({\tilde{\beta }}_{jl}\ne 0\). Thus, we can reduce computational complexity for estimating \({\varvec{B}}\).
To estimate \(\varvec{\theta }\), part of the update in (11) can be rewritten as
where \({\tilde{\theta }}_{j}\) is the estimate of \(\theta _{j}\) obtained from previous update. We update the third term of (16) only when \({\tilde{\theta }}_{j} \ne 0\), which reduces the computational complexity for estimating \(\varvec{\theta }\).
Monte Carlo simulations
Monte Carlo simulations were conducted to investigate the performance of the proposed method. We consider simulation scenarios by benchmark of previous studies on the network-based regularization [9, 10]. We simulated gene expression data under the assumed network. We supposed that each transcription factor gene (TF) regulates 10 genes and the TF expression levels are generated from a standard normal distribution.
The expression levels of each of the regulated genes (\({\varvec{y}}_{j}\), \(j=1,...10\)) of the TF (\({\varvec{x}}_{t}\)) were generated based on the expression level of \(t^{th}\) TF as follows,
where \(\epsilon ^{y}_{j}\sim N(0,\sigma _{y}^2)\).
The response variable \({\varvec{z}}\) is generated based on the regulatory effect of genes, i.e., based on the gene expression levels \({\varvec{X}}\) and the effect of regulators on targets \({\varvec{B}}=(\varvec{\beta }_{1},...,\varvec{\beta }_{k})\) as follows,
where \(\varvec{\epsilon }^{z}\sim N(0,\sigma ^{2}_{z})\).
For response variable predictive gene network estimation, we considered the following four scenarios.
- Scenario 1::
-
$$\begin{aligned}&\beta _{jt}=0.95, \quad j=1,...,10,\quad t=1,...,T\\&\varvec{\theta }=(1,\underbrace{\frac{1}{\sqrt{10}},..., \frac{1}{\sqrt{10}}}_{10},-1,\underbrace{\frac{-1}{\sqrt{10}},..., \frac{-1}{\sqrt{10}}}_{10},0.8,\underbrace{\frac{0.8}{\sqrt{10}},..., \frac{0.8}{\sqrt{10}}}_{10},-0.8,\underbrace{\frac{-0.8}{\sqrt{10}},..., \frac{-0.8}{\sqrt{10}}}_{10},0,...,0) \end{aligned}$$
- Scenario 2::
-
$$\begin{aligned}&\beta _{jt}=0.95,\quad j=1,...,5,\quad t=1,...,T\\&\beta _{jt}=0.80,\quad j=6,...,10,\quad t=1,...,T\\&\varvec{\theta }=(1,\underbrace{\frac{1}{\sqrt{10}},..., \frac{1}{\sqrt{10}}}_{10},-1,\underbrace{\frac{-1}{\sqrt{10}},..., \frac{-1}{\sqrt{10}}}_{10},0.8,\underbrace{\frac{0.8}{\sqrt{10}},..., \frac{0.8}{\sqrt{10}}}_{10},-0.8,\underbrace{\frac{-0.8}{\sqrt{10}},..., \frac{-0.8}{\sqrt{10}}}_{10},0,...,0) \end{aligned}$$
- Scenario 3::
-
$$\begin{aligned}&\beta _{jt}=0.95, \quad j=1,...,10,\quad t=1,...,T\\&\varvec{\theta }=(1,\underbrace{\frac{1}{\sqrt{5}},..., \frac{1}{\sqrt{5}}}_{10},-1,\underbrace{\frac{-1}{\sqrt{15}},..., \frac{-1}{\sqrt{15}}}_{10},0.8,\underbrace{\frac{0.8}{\sqrt{5}},..., \frac{0.8}{\sqrt{5}}}_{10},-0.8,\underbrace{\frac{-0.8}{\sqrt{15}},..., \frac{-0.8}{\sqrt{15}}}_{10},0,...,0) \end{aligned}$$
- Scenario 4::
-
$$\begin{aligned}&\beta _{jt}=0.95,\quad j=1,...,5,\quad t=1,...,T\\&\beta _{jt}=0.80,\quad j=6,...,10,\quad t=1,...,T\\&\varvec{\theta }=(1,\underbrace{\frac{1}{\sqrt{5}},..., \frac{1}{\sqrt{5}}}_{10},-1,\underbrace{\frac{-1}{\sqrt{15}},..., \frac{-1}{\sqrt{15}}}_{10},0.8,\underbrace{\frac{0.8}{\sqrt{5}},..., \frac{0.8}{\sqrt{5}}}_{10},-0.8,\underbrace{\frac{-0.8}{\sqrt{15}},..., \frac{-0.8}{\sqrt{15}}}_{10},0,...,0) \end{aligned}$$
The scenarios 1 and 2 are adapted from the works of Li and Li [9]. In order to consider different edge size of regulator on their target genes, which is reasonable for network biology, we also perform simulation studies based on scenarios 3 and 4 in line with Sun et al. [10].
We considered \(\sigma _{y}^2=0.5\) and simulated 50 datasets consisting of \(n=200\) observations from the 4 scenarios, where the training, validation, and test datasets consisted of 80% (160), 10% (20) and 10% (20) observations, respectively.
For each scenario, we considered the number of TFs (T) as 5, 10, 25, 50, and 100 (No. TFs). We chose the optimal regularization parameter combination that minimized the following mean squared error computed from the validation dataset.
where \({\hat{z}}_{i}=\hat{\varvec{\theta }}^{T}\hat{{\varvec{B}}}^{T}{\varvec{x}}_{i}\), \({\mathbb {V}}\) and \(n_{{\mathbb {V}}}\) are the set of indexes and sample size of validation dataset, respectively.
Our method was evaluated by comparing the prediction model based on an independently estimated network with prediction (NW.P), where the gene network was first estimated using the lasso. Then, the prediction of the response variable was based on the estimated network. We also considered prediction based on expression levels rather than networks, i.e. \({\varvec{X}}\) was used as an input of the prediction model. For these predictions, the lasso (LA), elastic net (EL), XGBoost (XGB) and neural network (NN) were used. For neural network, we used the fully-connected feed-forward neural network with a hidden layer based on ReLU activation function.
We compared the prediction results based on the prediction accuracy (mean squared error of the test sets) and the feature selection accuracy (true positive rates, true negative rates, and their average) of \(\varvec{\theta }\) in the prediction model and of \({\varvec{B}}\) in the network estimation. Table 1 shows the feature selection accuracies of the genes in the prediction model and the network edges, and the prediction accuracy for \(\sigma _{z}=0.1\). The column “Feature selection of genes” indicates the true positive rates, true negative rates, and their average for \(\varvec{\theta }\). The feature selection accuracies for \({\varvec{B}}\) are given in column “Feature selection of edges”. The average mean square errors for 50 datasets are given as the prediction accuracy in the column “MSE”. We also show the results for \(\sigma _{z}=0.5\) and \(\sigma _{z}=1\) in Tables 2 and 3, respectively.
As shown in Table 1, the proposed method shows effective performance for feature selection in the prediction model (i.e. \(\varvec{\theta }\)). Although there were not large differences in the true negative rate, our method shows outstanding performance for the true positive rate. Other methods show poor results for true positive results. Our results demonstrate effective overall feature selection and gene selection in the prediction model (i.e., the average of the true positive and negative rates). The outstanding feature selection results in a prediction model (i.e. \(\varvec{\theta }\)), which can be also seen for \(\sigma _{z}=0.5\) and \(\sigma _{z}=1\), as shown in Tables 2 and 3. Furthermore, the PredictiveNetwork provides effective gene network estimation, i.e. effective edge selection results (i.e. \({\varvec{B}}\)) were observed for all scenarios. Thus, our method provides efficient prediction accuracy overall. Although the predictive results are not very different between methods (i.e., Pro, NW.P, EL and LA), our strategy shows low prediction error in most scenarios.
We also illustrate the performances of the methods for various proportions of training dataset, i.e., 50%, 60%, 70% and 80% of n. We generate datasets from the scenarios for 30 TFs, \(\sigma =1\) and \(n=300\) and consider equal size of validation and test datasets. Table 4 shows the results of feature selection of genes (i.e., average of true positive and true negative for \(\varvec{\theta }\)) and prediction accuracy, where “ScnX” indicates the scenario X.
As shown in Table 4, the feature selection results are not significantly affected by the proportion of training datasets. On the other hand, the prediction error (i.e., MSE) is getting larger as the proportion of training datasets gets smaller, in overall. The loss of prediction accuracy as the training datasets get smaller proportion can be seen in the results of not only our method but also existing approaches. Although the proposed method suffers from the loss of accuracy in small proportion of training set, superiority of the PredictiveNetwork can also be confirmed for various proportions of training datasets. In short, the proposed method provides effective results for gene network estimation, feature selection, and accuracy of prediction models constructed by incorporating network biology.
Anti-gastric cancer drug sensitivity-predictive gene network analysis
To illustrate the proposed method, we applied our method to estimate drug sensitivity-predictive gene networks. We used a publicly available large scale pharmacogenomic data set, i.e. the “Sanger Genomics of Drug Sensitivity in Cancer (GDSC) dataset from the Cancer Genome Project”. The gene expression data (Cell_line_RMA_proc_basalExp.txt) and drug sensitivity data given as the half-maximal inhibitory concentration (IC50) and the Z-score for 345 compounds (GDSC1_fitted_dose_response_25Feb20.xlsx) are obtained from the GDSC dataset (https://www.cancerrxgene.org/downloads/bulk_download). We focused on FDA-approved drugs for stomach (gastric) cancer (https://www.cancer.gov/about-cancer/treatment/drugs/stomach). Among the 18 approved drugs, we considered four drugs: doxorubicin, Mitomycin-c, 5-Fluorouracil (5-FU), and Docetaxel that have drug sensitivity values in GDSC dataset. The expression levels of 10% of the genes (976 genes) with the highest variance in all cell lines were used for drug sensitivity-predictive network estimation. For each drug, we matched the expression levels and drug sensitivity (Z-score of IC50 value) for each cell line. The matching returned 948, 855, 891, and 948 cell lines consisting of around 30 cancer types for doxorubicin-, mitomycin-c-, 5-FU-, and docetaxel-sensitive predictive network estimation, respectively.
The prediction model consisted of 80%, 10%, and 10% of cell lines for the training, validation, and test datasets. Similar to the simulation study, we evaluated the prediction accuracy of our method by comparing the prediction results based on separately estimated networks (NW.P) and gene expression based prediction by lasso (LA) and elastic net (EL). The prediction results of the gastric cancer drug sensitivities are given in Fig. 1.

Prediction accuracy of anti-cancer drugs for gastric cancer
The proposed method shows effective results for predicting sensitivity to Mitomycin-c, 5-FU, and Docetaxel, while the elastic net showed outstanding performance for doxorubicin.
We next considered drug response predictive marker identification for gastric cancer. Genes having non-zero coefficient values (\(\varvec{\theta }\)) were considered as drug response predictive markers. Markers identified for all four drugs were considered as common markers that predict responses to anti-gastric cancer drugs. Table 5 shows the common markers, where the columns “ Gastric cancer drug” and “Gastric cancer” indicate evidence related to the mechanism of the anti-cancer drugs and gastric cancer, respectively.
As shown in Table 5, more than half of the identified common markers were previously identified as markers for anti-cancer drugs and gastric cancer. AKR1C1 is a well-known marker of drug resistance. The mechanism of AKR1C1 underlying the acquired anti-cancer drug resistance has drawn a large amount of attention.
Marker for anti-cancer drugs
-
AKR1C1
Activation of the Nrf2/AKR1C axis contributes to oxaliplatin resistance in TSGH-S3 cells. Manipulating Nrf2/AKR1Cs activity may be useful for managing oxaliplatin-refractory gastric cancer [18]. The AKR1C family is involved in chemotherapy resistance in stomach, colon, lung, and brain cancers [19]. Furthermore, AKR1C1 and AKR1C3 inactivate doxorubicin cytotoxicity and are involved in oxaliplatin-resistant gastric cancer. IL-6, AKR1C1, and AKR1C3 are the top 3 upregulated genes in TSGH-S3 human gastric carcinoma cells. A specific inhibitor of AKR1C1 and AKR1C3 was used to enhance cisplatin-induced cisplatin-resistance in signet ring cell gastric carcinoma (SRCGC) cells [19]. Genes from the AKR1C family are associated with resistance to CDDP and 5-FU. Controlling these genes enhances sensitivity to anti-cancer drugs by inhibiting cellular activity in drug-resistant cancer cells. Overexpression of AKR1C family was observed upon the acquisition of doxorubicin resistance. Various AKR family members are among the most differentially expressed genes upon the acquisition of doxorubicin resistance [20]. These findings suggest that AKRs may play a key role in doxorubicin resistance. Many anti-cancer drugs, e.g., doxorubicin, daunorubicin, and haloperidol, are metabolized by carbonyl-reducing enzymes including AKR1A1, AKR1B1, AKR1B10, AKR1C1, AKR1C2, and AKR1C3. The aldo-keto reductase (AKR) superfamily is also involved in the development of drug resistance in cancer cells [39]. AKR1C1 and AKR1C3 play a key role in cisplatin resistance in SRCGC by regulating redox-dependent autophagy. Further, AKR1C1 is a crucial regulator of cisplatin-resistance in head and neck squamous cell carcinoma (HNSCC) and is a poor prognostic factor for HNSCC patient death [21]. Finally, AKR1C1 is upregulated by IL-6 and Nrf2 and promotes acquired cisplatin-resistance in metastatic ovarian and gastric cancer cells. The overexpression of AKR1B1, AKR1C1, AKR1C2, and AKR1C3 is responsible for the early appearance of doxorubicin drug resistance [22]. Sensitivity to cisplatin, cis-diamminedichloroplatinum (CDDP), and 5-FU is restored when AKR1C1, AKR1C2, AKR1C3, and AKR1C were knocked down. Inhibiting AKR1C family genes enhances sensitivity to CDDP and 5-FU [23]. AKR1C1 plays an crucial role in drug resistance in bladder cancer cells [24]. Overexpression of AKR genes in cancer cells that are resistant to chemotherapeutic agents (i.e., cisplatin, doxorubicin, duanorubciin, mitomycin, emozolomide, cyclophosphosphamide, and oracin) is common [40]. Resistance to enzalutamide is caused by AKR1C3 overexpression.
-
CRYAB
CRYAB protein levels are significantly reduced after doxorubicin treatment [30]. PDCryab1, a peptide from CRYAB, is a candidate for protecting the myocardium against doxorubicin-induced cell apoptosis.
-
PEG10
Knocking down PEG10 enhances the sensitivity of MKN7 cells (human gastric adenocarcinoma cells) to docetaxel [35]. Inhibiting PEG10 expression enhances the effect of 5-FU on apoptosis, and PEG10 is upregulated in cases treated with neoadjuvant docetaxel. [36].
Markers for gastric cancer
-
AKR1C1
AKR1C1 is a potential biomarker and therapeutic target for gastric cancer [25].
-
CRYAB
CRYAB is a therapeutic target for gastric cancer [31]. CRYAB is a prognostic biomarker and therapeutic target in human solid tumors. The role of CRYAB in anti-cancer invasion and metastasis via epithelial-mesenchymal transition (EMT) was recently uncovered [32]. Increased CRYAB expression is associated with poor overall survival in digestive system cancer patients. CRYAB contributes to gastric cancer cell migration and invasion via EMT, which is mediated by the NF-\(\kappa\)B signaling pathway. Tao et al. [33] demonstrated that high CRYAB levels are related to angiogenesis and poor prognosis in gastric cancer.
-
TMEM139
TMEM139 was identified as a differentially expressed gene in intestinal metaplasia that does not progress to gastric cancer [34].
-
PEG10
PEG10 is a high lymph node ratio-associated gene whose expression is positively correlated with pathological stage III gastric cancer [35]. Knockdown of PEG10 suppresses proliferation, invasion, and decreases chemo-resistance in gastric cancer cells. Silencing lncRNA PEG10 inhibits the occurrence and progression of gastric cancer [38].
-
ZG16B1
ZG16B is a tumorigenic factor and diagnostic marker in pancreatic, gastric, colon, ovarian, oral squamous cell, and cervical carcinoma [29].
To uncover common regulatory systems involved in gastric drug responses, we constructed a gene network based on the target and regulator genes of the common markers. We consider the regulator (target) genes of the common markers in the estimated networks for more than one drug as common regulators (target) of the identified markers. Hereafter, we refer the common genes, common regulator and target genes as identified gastric cancer drug markers. For the identified markers, we extract their networks from \(\hat{{\varvec{B}}}^{\text {doxorubicin}}\), \(\hat{{\varvec{B}}}^{\text {mitomycin-c}}\), \(\hat{{\varvec{B}}}^{\text {5-FU}}\), \(\hat{{\varvec{B}}}^{\text {docetaxel}}\) estimated for the doxorubicin, mitomycin-c, 5-Fluorouracil (5-FU), and docetaxel -networks, respectively. To clearly visualize the network, we consider edges having absolute values of \(B_{jl}\) greater than 0.1. We then compute median of the edge sizes (\({\hat{B}}_{jl}^{\text {doxorubicin}}\), \({\hat{B}}_{jl}^{\text {mitomycin-c}}\), \({\hat{B}}_{jl}^{\text {5-FU}}\), \({\hat{B}}_{jl}^{\text {docetaxel}}\) that indicate strength of effect of gene l on gene j, i.e., \(\varvec{x_{l}} \rightarrow {\varvec{x}}_{j}\)), and we let the median of edge size as \(B^{CM}_{jl}\). Top of Fig. 2 shows the gene regulator network described by \(B^{CM}_{jl}\) .

Gene networks for the identified gastric cancer drug markers in drug-sensitive and -resistant cell lines . Edge thickness represents the strength of effect of regulator on target genes (i.e., \(|\beta |\)) and color indicates sign of the effect (red: “-” and blue: “+”). Node size represents degree of connectivity (i.e., hubness) of each gene in the networks
AKR1C1, a crucial marker of drug resistance, is a hub gene in gastric cancer drug sensitivity-predictive gene networks. Strong interaction between AKR1C1 and AKR1C3 was present in the network, which implies that AKR family genes are tumorigenic factors and diagnostic markers for gastric cancer. Further, our results suggest that these genes may be activated by molecular interactions rather than the activity of a single gene. There is abundant evidence that the AKR1C family, including AKR1C1 and AKR1C3, plays a key role in drug resistance of gastric cancer. These findings imply that our method provides biologically reliable results and that the constructed network for gastric cancer drugs may have crucial information to uncover mechanism-related therapeutic resistance and chemotherapy effectiveness. Importantly, these factors cannot be identified without considering molecular interactions.
To identify gastric cancer drug-sensitive and -resistant molecular interactions, we estimated drug-sensitive and -resistant networks based on identified gastric cancer drug markers. We extracted data from 400 drug-sensitive and -resistant cell lines. This data corresponded to the 400 largest (resistant) and 400 smallest (sensitive) drug sensitivity values of each drug. We then extracted the overlapping drug-sensitive and -resistant) cell lines for the four drugs (95 drug sensitive and 95 drug resistant cell lines were extracted) and estimated gene networks based on these cell lines. For each 95 drug sensitive and 95 drug resistant cell lines, we estimate drug sensitive and resistant gene networks (i.e., \(NW^{st}\) and \(NW^{rs}\)) consisting of the 10% of the genes (976 genes) having the highest variance by using the lasso, i.e., the regulatory system between target gene \({\varvec{y}}_{j}\) and regulator genes \({\varvec{x}}_{l}\) is estimated as \(\beta _{jl}\) by (2) with \(\lambda _{1}=0\). The gene networks are described by \(\hat{{\varvec{B}}}^{st}\) and \(\hat{{\varvec{B}}}^{rs}\) for drug sensitive and resistant cell lines, respectively. From \(\hat{{\varvec{B}}}^{st}\) and \(\hat{{\varvec{B}}}^{rs}\), we extract the network consisting of the identified gastric cancer drug markers, where the edges having absolute values of \(B_{jl}\) greater than 0.1 are only extracted to clearly visualize the networks The bottom of Fig. 2 shows the gene networks of the identified gastric cancer drug markers for drug-sensitive and -resistant cell lines.
Our results show that the identified gastric cancer drug markers have different regulatory systems in drug-sensitive and -resistant cell lines. AKR1C1 and AKR1C3 show strong interactions in both drug-sensitive and -resistant cell lines. The hubness of AKR1B10 is a characteristic of drug-resistant gastric cancer cells. Indeed, the hubness of AKR1B10 was significantly smaller in drug-resistant cells compared to sensitive cell lines. The hubness of AKR1C3 also became smaller in drug-sensitive cell lines compared with networks estimated from drug-resistant cell lines. The activity of AKR family genes in drug resistant cell lines was strongly supported by previous studies [19,20,21,22,23,24, 39, 40].
In contrast, the hubnesses of ANXA10 and ZNF165 are characteristics of drug-sensitive gastric cancer cells. ANXA10 and AKR1C1 showed strong interactions in drug-sensitive cell lines, while their interaction disappeared in drug-resistant cell lines. The hubness of ZNF165 becomes weaker from the drug sensitive to resistant cell lines. Thus, high activities of ANXA10 and ZNF165 can be considered as signatures of drug-sensitive cell lines. It has been identified that ANXA10 is a crucial marker of gastric cancer and its related mechanism for drug sensitivity has been uncovered as follows. ANXA10, a novel gastric marker, shows extensive tissue and subclonal heterogeneity of dual stomach-intestinal cell states [41]. Additionally, ANXA10 is significantly upregulated in gastric carcinoma and downregulated in gastric carcinogenesis [42]. Overexpression of ANXA10 in MKN-1 human gastric adenosquamous carcinoma cells leads to cell growth and increased apoptotic cells. These results suggest that ANXA10 plays a crucial role as a tumor suppressor in gastric cancer cells by restraining cell growth and inducing basal apoptosis. In around half of gastric cancer cases, ANXA10 is detected. Loss of ANXA10 is significantly correlated with disease progression and poor clinical outcomes in gastric cancer [43]. Repressed cell growth was observed in ANXA10-knockdown human gastric organoids. Hierarchical clustering showed that KLK6 and ANXA10 are enriched in cancer organoids that showed higher sensitivity to erlotinib [44]. Overexpression of ANXA10 in human epithelial cancer cells increases sensitivity to doxorubicin-induced apoptosis and reduces clonogenic ability [45]. ZNF165 is a novel cancer antigen capable of eliciting humoral immune responses and is involved in tumour biology [46]. Further, ZNF165 is expressed in gastric cancer, colon cancer, and non-small-cell lung carcinoma. Previous studies strongly support our data-driven results that high ANXA10 activity is a characteristic of drug-sensitive gastric cancer cells. Drug-sensitive and/or -resistance-specific molecular interactions may be crucial clues for uncovering drug resistance/senstivity mechanisms. We show regulatory effects for drug-sensitive and -resistance-specific markers, where the regulatory effect is computed by the combined regulator expression level and the effect of the regulator on its target gene. For the drug sensitive and resistant cell lines, the regulatory effect of \(l^{th}\) regulator gene on \(j^{th}\) target gene is described by \({\varvec{x}}^{st}_{l}{\hat{\beta }}^{st}_{jl}\) and \({\varvec{x}}^{rs}_{l}{\hat{\beta }}^{rs}_{jl}\), respectively, where \({\varvec{x}}^{st}_{l}\) (\({\varvec{x}}^{rs}_{l}\)) is the expression levels of gene l in drug sensitive (resistant) cell lines obtained from GDSC dataset and \({\hat{\beta }}^{st}_{jl}\) (\({\hat{\beta }}^{rs}_{jl}\)) is the estimated effect of gene l on gene j in drug sensitive (resistant) network (i.e., \(\hat{{\varvec{B}}}^{st}\) and \(\hat{{\varvec{B}}}^{rs}\) which are estimated for Fig. 2). Thus, gene activity can be described by the regulatory effect. Figure 3 shows the regulatory effect of the identified gastric cancer drug-sensitive and -resistant markers on their targets (row: Targets) and the regulatory effect of their regulators on the identified markers (row: Regulators) in drug-sensitive and -resistant cell lines. As shown in Fig. 3, the identified drug sensitive markers ANXA10 and ZNF165 showed high activity in drug-sensitive cell lines, especially the effects of their regulators on ANXA10 and ZNF165 are disappeared in drug resistant cell lines (i.e., \({\hat{\beta }}^{rs}=0\)). Especially, their regulators show a large regulatory effect on ANXA10 and ZNF165 in drug-sensitive cell lines. These effects become smaller in the drug-resistant cells. The drug resistance markers also showed clearly different activities between drug-sensitive and -resistant cell lines. The genes regulating AKR1B10 act only in drug resistant cell-lines, and interactions between regulators and AKR1B10 disappeared in drug-sensitive cells.

Regulatory effects of the gastric cancer drug -sensitivity and -resistance markers. The regulatory effects of genes indicate \({\varvec{x}}^{st}_{l}{\hat{\beta }}^{st}_{jl}\) and \({\varvec{x}}^{rs}_{l}{\hat{\beta }}^{rs}_{jl}\) for drug sensitive and resistant cell lines, respectively, where \({\hat{\beta }}^{st}_{jl}\) and \({\hat{\beta }}^{rs}_{jl}\) are estimated in drug sensitive and resistant networks in Fig. 2. “Targets” indicates regulatory effect of the identified markers on their target genes and “Regulators” indicates regulatory effect of the genes on the identified markers in drug sensitive and resistant networks (i.e., \(NW^{st}\) and \(NW^{rs}\))
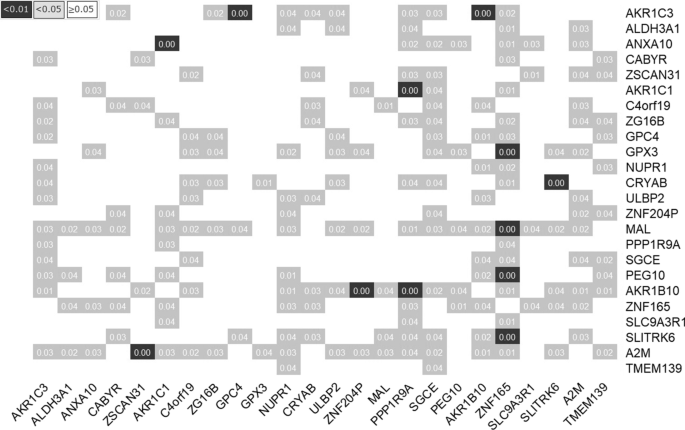
Significance of difference of molecular interactions between drug-sensitive and -resistant cell lines. The color indicates the significance of the interaction: white, grey, and black means p value\(\ge 0.05\), p value\(<0.05\) and p value\(<0.01\), respectively
We then identify molecular interactions that show significantly different regulatory system between drug-sensitive and -resistant cell lines. We randomly selected 95 cell lines and estimated networks (permuted drug-sensitive networks) similar to the networks in the bottom of Fig. 2. We also estimated permuted drug-resistant networks based on 95 randomly-selected cell lines. The differences between the two networks were computed for 1000 randomly-selected permutation samples (\(DF(pm), \quad pm=1,...,1000\)). We computed the following permutation p value based on the difference between the two networks given in Fig. 2 (\(DF_{true}\)) and DF(pm),
where \({\varvec{I}}(\cdot )\) is the indicator function. The \(p~\text {value}_{pm}\) indicates the proportion that the absolute difference of edges in drug sensitive and resistant cell lines (\(DF_{true}\)) is smaller than the absolute differences computed from the 1000 permuted samples (\(DF_{pm}\)). The \(p~\text {value}_{pm}\) indicates that two genes show extremely different regulatory system between drug sensitive and resistant cell lines.
Figure 4 shows the \(p~\text {value}_{perm}\) of permutation test to test difference of the regulatory system of the identified gastric cancer drug markers, where the markers are considered as not only regulator (rows) but also target (columns) genes. The identified drug resistance marker AKR1B10 showed significantly different regulatory effects on AKR1C3. Furthermore, another drug resistance marker, ZNF165, had several significantly different molecular interactions for its target genes (i.e., GPX3, MAL, PEG10, and SLITRK6). Further, the drug sensitivity markers AKR1C3 and ANXA10 had significantly different regulatory systems with their regulators (AKR1C3: GPC4 and PEG10, ANXA10: AKR1C1). In addition to ANXA10, ZNF165, AKR1C1 and AKR1B10, we identified several more genes as common predictive markers for the four gastric cancer drugs (i.e., genes in the networks) that showed significant differences in the networks of drug sensitive and resistant cell lines (p value < 0.05). These results imply that identified gastric cancer drug markers have significantly different regulatory systems in the gene networks between the drug-sensitive and -resistant cell lines.
From these results, we suggest that the high activity of AKR family genes may be involved in acquired drug resistance. Thus, controlling suppressors of AKR family genes may enhance the sensitivity to gastric cancer drugs (Additional file 1: Table S1). Our results also suggest that loss of ANXA10 activity may lead to drug resistance. Although little evidence for the role of ZNF165 were found for mechanisms related to gastric cancer or anti-cancer drugs, it can be suggested that ZNF165 is a novel marker of gastric cancer drug responses. The controlling inducers of ANXA10 and ZNF165 may lead to enhanced drug sensitivity (Additional file 1: Table S1).
Discussion
We introduced a novel computational strategy for response variable predictive gene network estimation. To identify biological mechanism-specific gene networks, we propose a model that consists of gene network estimation and prediction of a specific biological process. Furthermore, we incorporated network biology into the prediction model, which enabled the PredictiveNetwork to simultaneously perform gene network estimation and prediction. Our method estimates gene networks that achieves minimized prediction and network estimation errors. Thus, we can identify response prediction-specific characteristics of gene networks. Additionally, our method can construct prediction models based on crucial subnetworks involved in specific biological processes. These lead to effective interpretation of prediction results and biologically-reliable predictive marker identification.
Graph Attention Networks (GAN) [47] is a strategy that also performs network estimation and prediction, simultaneously. GAN is a neural network approach that leverages masked self-attentional layers based on similarity of node in neighborhoods. Thus, gene regulatory system can be described by clinical characteristic-specific self-attention network. On the other hand, the gene network estimation procedure of the PredictiveNetwork can be considered as clinical characteristic specific graphical gaussian modeling and the estimated gene regulatory network is given as weighted-directed adjacency matrix.
To illustrate the proposed strategy, we performed Monte Carlo simulations. The simulation results showed that the proposed strategy has outstanding performance for feature selection in gene network estimation and prediction. Our results also demonstrate excellent prediction accuracy. We applied the proposed PredictiveNetwork to estimate gene networks that are responsive to gastric cancer drugs. Using the GDSC dataset, we estimated doxorubicin, Mitomycin-C, 5-FU, and Docetaxel-responsive gene networks. The identified gastric drug response markers showed significantly different regulatory systems between drug-sensitive and -resistant cell lines. Combined with previous studies, the identified gastric drug response markers and drug sensitivity/resistance-specific markers have strong evidence for mechanisms related to anti-cancer drugs and gastric cancer. In particular, our results indicate that AKR family genes are likely drug resistance markers. We identified the drug sensitivity-specific activity of ANXA10 and ZNF162, which is strongly supported by previous studies. Collectively, our results of GDSC data analysis suggest that the molecular interplay between ARK family genes and ANXA10/ZNF162 activity play key role in the mechanisms underlying acquired resistance/sensitivity to gastric cancer drugs. Manipulating suppressors and induces of ARK family genes, ANXA10, and ZNF162 may be a way to reduce drug resistance of cancer cell lines.
Availability of data and materials
The datasets are available from Sanger Genomics of Drug Sensitivity in Cancer (GDSC) dataset(https://www.cancerrxgene.org/). R script for PredictiveNetwork is available at https://drive.google.com/file/d/1DdxnWtHeYcF_6H4yQQYN3NTNGTRYtD_f/view?usp=sharing.
References
Cheng F, Kovacs I, Barabasi A. Network-based prediction of drug combinations. Nat Commun. 2019;10(1197):1–11.
Aloraini A, ElSawy KM. Potential breast anticancer drug targets revealed by differential gene regulatory network analysis and molecular docking: neoadjuvant docetaxel drug as a case study. Cancer Inform. 2018;17:1176935118755354.
Daoud M, Mayo M. A survey of neural network-based cancer prediction models from microarray data. Artif Intell Med. 2019;97:204–14.
Kamada M, Takagi A, Kojima R, Tanaka Y, Nakatsui M, Tanabe N, et al. Network-based pathogenicity prediction for variants of uncertain significance. bioRxiv [cited 2021 August 14]. Available from: https://doi.org/10.1101/2021.07.15.452566.
Veličković P, Cucurull G, Casanova A, Romero A, Lió P, Bengio Y. Graph attention networks. arXiv:1710.10903 [submitted 2018 Feb 4].
Kim S, Bae S, Piao Y, Jo K. Graph convolutional network for drug response prediction using gene expression data. Mathematics. 2021;9(7):772.
Wei D, Liu C, Zheng X, Li Y. Comprehensive anticancer drug response prediction based on a simple cell line-drug complex network model. BMC Bioinform. 2019;20(1):44.
Manica M, Oskooei A, Born J, Subramanian V, Sáez-Rodríguez J, et al. Toward explainable anticancer compound sensitivity prediction via multimodal attention-based convolutional encoders. Molec Pharm. 2019;16(12):4797–806.
Li C, Li H. Network-constrained regularization and variable selection for analysis of genomic data. Bioinformatics. 2008;24(9):1175–82.
Sun H, Lin W, Feng R, Li H. Network-regularized high-dimensional cox regression for analysis of genomic data. Stat Sin. 2014;24(3):1433–59.
Yu D, Lim J, Wang X, Liang F, Xiao G. Enhanced construction of gene regulatory networks using hub gene information. BMC Bioinform. 2017;18(1):186.
Tibshirani R. Regression shrinkage and selection via the lasso. J R Stat Soc Ser B. 1996;58:267–88.
Zou H, Hastie T. Regularization and variable selection via the elastic net. J R Stat Soc Ser B. 2005;67:301–20.
Tibshirani R, Saunders M, Rosset S, Zhu J, Knight K. Sparsity and smoothness via the fused lasso. J R Stat Soc B. 2005;67:91–108.
Fan J, Li R. Variable selection via nonconcave penalized likelihood and its oracle properties. J Am Stat Assoc. 2001;96:1348–60.
Friedman J, Hastie T, Tibshirani R. Regularization paths for generalized linear models via coordinate descent. J Stat Softw. 2010;33(1):1–22.
Kawano S, Fujisawa H, Takada T, Shiroishi T. Sparse principal component regression with adaptive loading. Comp Stat Data Anal. 2015;89:192–203.
Chen C, Chu C, Liu K, Huang C, Chang J, Pan W, et al. Gene expression profiling for analysis acquired oxaliplatin resistant factors in human gastric carcinoma TSGH-S3 cells: the role of IL-6 signaling and Nrf2/AKR1C axis identification. Biochem Pharmacol. 2013;86(7):872–87.
Phoo N, Dejkriengkraikul P, Khaw-On P, Yodkeeree S. Transcriptomic profiling reveals AKR1C1 and AKR1C3 mediate cisplatin resistance in signet ring cell gastric carcinoma via autophagic cell death. Int J Mol Sci. 2021;22(22):12512.
Heibein A, Guo B, Sprowl J, Maclean D, Parissenti A. Role of aldo-keto reductases and other doxorubicin pharmacokinetic genes in doxorubicin resistance, DNA binding, and subcellular localization. BMC Cancer. 2012;12:381. https://doi.org/10.1186/1471-2407-12-381.
Chang W, Chang Y, Yang Y, Lin S, Chang P, Hsiao M. AKR1C1 controls cisplatin-resistance in head and neck squamous cell carcinoma through cross-talk with the STAT1/3 signaling pathway. J Exp Clin Cancer Res. 2019;38(1):245. https://doi.org/10.1186/s13046-019-1256-2.
Penning T, Jonnalagadda S, Trippier P, Rižner T. Aldo-keto reductases and cancer drug resistance. Pharmacol Rev. 2021;73(3):1150–71.
Shiiba M, Yamagami H, Yamamoto A, Minakawa Y, Okamoto A, Kasamatsu A, et al. Mefenamic acid enhances anticancer drug sensitivity via inhibition of aldo-keto reductase 1C enzyme activity. Oncol Rep. 2017;37(4):2025–32.
Matsumoto R, Tsuda M, Yoshida K, Tanino M, Kimura T, Nishihara H, et al. Aldo-keto reductase 1C1 induced by interleukin-1β mediates the invasive potential and drug resistance of metastatic bladder cancer cells. Sci Rep. 2016;6:34625. https://doi.org/10.1038/srep34625.
Zheng S, Yang L, Dai Y, Jiang L, Wei Y, Wen H, et al. Screening and survival analysis of hub genes in gastric cancer based on bioinformatics. J Comput Biol. 2019;26(11):1316–25.
Singh H, Ha K, Hornick J, Madha S, Cejas P, Jajoo K, et al. Hybrid stomach-intestinal chromatin states underlie human Barrett’s metaplasia. Gastroenterology. 2021;161(3):924-939.e11.
Cho J, Kim S, Park S, Kim H, Song S. Suppression of pancreatic adenocarcinoma upregulated factor (PAUF) increases the sensitivity of pancreatic cancer to gemcitabine and 5FU, and inhibits the formation of pancreatic cancer stem like cells. Oncotarget. 2017;8(44):76398–407.
Lu H, Shi C, Liu X, Liang C, Yang C, Wan X, et al. Identification of ZG16B as a prognostic biomarker in breast cancer. Open Med (Wars). 2020;16(1):1–13.
Yoo W, Choi H, Son Y, Lee J, Jo S, Jung D, et al. Pancreatic cancer induces muscle wasting by promoting the release of pancreatic adenocarcinoma upregulated factor. Exp Mol Med. 2021;53(3):432–45.
Zhang L, Wang X, Feng M, Zhang H, Xu J, Ding J, et al. Peptidomics analysis reveals peptide PDCryab1 inhibits doxorubicin-induced cardiotoxicity. Oxid Med Cell Longev. 2020;2020:7182428. https://doi.org/10.1155/2020/7182428.
Chen D, Cao G, Qiao C, Liu G, Zhou H, Liu Q. Alpha B-crystallin promotes the invasion and metastasis of gastric cancer via NF-κB-induced epithelial-mesenchymal transition. J Cell Mol Med. 2018;22(6):3215–22.
Yang M, Li Y, Tian F. Association between Alpha B-crystallin expression and prognosis in patients with solid tumors: a protocol for systematic review and meta-analysis. Medicine (Baltimore). 2021;100(7):e24831.
Tao X, Cheng L, Li Y, Ci H, Xu J, Wu S, et al. Expression of CRYAB with the angiogenesis and poor prognosis for human gastric cancer. Medicine (Baltimore). 2019;98(45):e17799.
Companioni O, Sanz-Anquela J, Pardo M, Puigdecanet E, Nonell L, García N, Blanco V, et al. Gene expression study and pathway analysis of histological subtypes of intestinal metaplasia that progress to gastric cancer. PLoS ONE. 2017;12(4): e0176043.
Ishii S, Yamashita K, Harada H, Ushiku H, Tanaka T, Nishizawa N, et al. The H19-PEG10/IGF2BP3 axis promotes gastric cancer progression in patients with high lymph node ratios. Oncotarget. 2017;8(43):74567–81.
Xiong J, Qin J, Zheng Y, Peng X, Luo Y, Meng X. PEG10 promotes the migration of human Burkitt’s lymphoma cells by up-regulating the expression of matrix metalloproteinase-2 and -9. Clin Invest Med. 2012;35(3):E117-25.
Kim S, Thaper D, Bidnur S, Toren P, Akamatsu S, Bishop J, et al. PEG10 is associated with treatment-induced neuroendocrine prostate cancer. J Mol Endocrinol. 2019;63(1):39–49.
Wang S, Cheng Y, Yang P, Qin G. Silencing of long noncoding RNA LINC00324 interacts with MicroRNA-3200-5p to attenuate the tumorigenesis of gastric cancer via regulating BCAT1. Gastroenterol Res Pract. 2020;2020:4159298. https://doi.org/10.1155/2020/4159298.
Li W, Hou G, Zhou D, Lou X, Xu Y, Liu S, et al. The roles of AKR1C1 and AKR1C2 in ethyl-3,4-dihydroxybenzoate induced esophageal squamous cell carcinoma cell death. Oncotarget. 2016;7(16):21542–55. https://doi.org/10.18632/oncotarget.7775.
Penning T. Aldo-keto reductase regulation by the Nrf2 system: implications for stress response, chemotherapy drug resistance, and carcinogenesis. Chem Res Toxicol. 2017;30(1):162–76.
Singh S, Bhat M, Sathe G, Gopal C, Sharma J, Madugundu A, et al. Proteomic signatures of diffuse and intestinal subtypes of gastric cancer. Cancers (Basel). 2021;13(23):5930. https://doi.org/10.3390/cancers13235930.
Kim J, Kim P, Jung K, Noh J, Eun J, Bae H, et al. Decreased expression of annexin A10 in gastric cancer and its overexpression in tumor cell growth suppression. Oncol Rep. 2010;24(3):607–12.
Ishikawa A, Sakamoto N, Honma R, Taniyama D, Fukada K, Hattori T, et al. Annexin A10 is involved in the induction of pancreatic duodenal homeobox 1 in gastric cancer tissue, cells and organoids. Oncol Rep. 2020;43(2):581–90.
Saito Y, Muramatsu T, Kanai Y, Ojima H, Sukeda A, Hiraoka N, et al. Establishment of patient-derived organoids and drug screening for biliary tract carcinoma. Cell Rep. 2019;27(4):1265-1276.e4.
Quiskamp N, Poeter M, Raabe C, Hohenester U, König S, Gerke V, et al. The tumor suppressor annexin A10 is a novel component of nuclear paraspeckles. Cell Mol Life Sci. 2014;71(2):311–29.
Dong X, Yang X, Wang Y, Chen W. Zinc-finger protein ZNF165 is a novel cancer-testis antigen capable of eliciting antibody response in hepatocellular carcinoma patients. Br J Cancer. 2004;91(8):1566–15070.
Velickovic P, Cucurull G, Casanova A, Romero A, Lio P, Bengio Y. Graph attention networks. In: ICLR; 2018.
Acknowledgements
This research used the computational resources of the Super Computer System, Human Genome Center, Institute of Medical Science, University of Tokyo.
Funding
This work was supported by MEXT as “Program for Promoting Researches on the Supercomputer Fugaku” (Unravelling origin of cancer and diversity by largescale data analysis and artificial intelligence technology, Project ID: JPMXP1020200102, hp200138, hp210167, hp220163), and by JSPS KAKENHI (JP19K20402, JP22K12259).
Author information
Authors and Affiliations
Contributions
H.P developed the method, performed the analysis, and drafted the manuscript. S.I and S.M supervised the work. All authors have read and approved the final version of the manuscript.
Corresponding author
Ethics declarations
Ethics approval and consent to participate
Not applicable.
Consent for publication
Not applicable.
Competing interests
The authors declare that they have no competing interests.
Additional information
Publisher's Note
Springer Nature remains neutral with regard to jurisdictional claims in published maps and institutional affiliations.
Supplementary Information
Additional file 1
. The list of suppressors and inducers for AKR1B10, AKR1C3, ANXA10 and ZNF165.
Rights and permissions
Open Access This article is licensed under a Creative Commons Attribution 4.0 International License, which permits use, sharing, adaptation, distribution and reproduction in any medium or format, as long as you give appropriate credit to the original author(s) and the source, provide a link to the Creative Commons licence, and indicate if changes were made. The images or other third party material in this article are included in the article's Creative Commons licence, unless indicated otherwise in a credit line to the material. If material is not included in the article's Creative Commons licence and your intended use is not permitted by statutory regulation or exceeds the permitted use, you will need to obtain permission directly from the copyright holder. To view a copy of this licence, visit http://creativecommons.org/licenses/by/4.0/. The Creative Commons Public Domain Dedication waiver (http://creativecommons.org/publicdomain/zero/1.0/) applies to the data made available in this article, unless otherwise stated in a credit line to the data.
About this article

Cite this article
Park, H., Imoto, S. & Miyano, S. PredictiveNetwork: predictive gene network estimation with application to gastric cancer drug response-predictive network analysis. BMC Bioinformatics 23, 342 (2022). https://doi.org/10.1186/s12859-022-04871-z
Received:
Accepted:
Published:
DOI: https://doi.org/10.1186/s12859-022-04871-z