- Methodology article
- Open access
- Published:
Application of the common base method to regression and analysis of covariance (ANCOVA) in qPCR experiments and subsequent relative expression calculation
BMC Bioinformatics volume 21, Article number: 423 (2020)
Abstract
Background
Quantitative polymerase chain reaction (qPCR) is the technique of choice for quantifying gene expression. While the technique itself is well established, approaches for the analysis of qPCR data continue to improve.
Results
Here we expand on the common base method to develop procedures for testing linear relationships between gene expression and either a measured dependent variable, independent variable, or expression of another gene. We further develop functions relating variables to a relative expression value and develop calculations for determination of associated confidence intervals.
Conclusions
Traditional qPCR analysis methods typically rely on paired designs. The common base method does not require such pairing of samples. It is therefore applicable to other designs within the general linear model such as linear regression and analysis of covariance. The methodology presented here is also simple enough to be performed using basic spreadsheet software.
Background
The cells of an organism contain a large set of genes that encode information for constructing RNA and protein. Despite access to all of this information, individual cells may only transcribe a very small percentage of their genes [1]. Comparisons between unique cell types may show dramatic differences not only in the specific genes expressed but also in the expression level of commonly accessed genes [2]. Furthermore, expression levels are not expected to remain constant; in fact, our expectation is that expression levels will change in response to internal and external inputs, developmental state, and even disease state [3,4,5].
A central goal would be to elucidate a set of genes expressed and determine exactly how expression changes in response to external and internal signals and ultimately link this response to phenotypic changes. For this goal, quantification of gene expression could be performed in a variety of different ways via different methodologies [6], but the most common is to use differences in mRNA concentrations to quantify what is called relative expression that utilizes the polymerase chain reaction (PCR) to make detection of differences in initial RNA concentration possible [7]. Quantitative PCR (qPCR) has become the gold standard for such quantification and has become the technique of choice for diverse research questions [8,9,10].
The growth of amplicons within a qPCR reaction is expected to follow a logistic growth model where the increase in amplicons is exponential up until the point where reagents in the qPCR reaction begin to become limiting [8]. Because of this, Livak and Schmittgen [11] use the number 2 in their calculation of relative expression (equation 1) to indicate the potential for a doubling of the amplicon number each PCR cycle:
This equation couples together the Cq values from Treatment A for both a gene of interest (GOI) and a reference gene (REF) and does the same for Treatment B. The difference in the exponent in Cq values for GOI and REF is referred to as a ∆Cq value, and the difference between two ∆Cq values as a ∆∆Cq value [11].
From a theoretical perspective amplicons are expected to double each PCR cycle, yet many have shown that for various reasons this does not happen [12,13,14], and neglecting this fact can have measurable impacts on gene expression calculations [15, 16]. Others [15, 17] have developed methods for determining relative expression by incorporating a measure of the growth rate of a population of amplicons, called an efficiency value (E).
Though not readily apparent in this formulation, the Pfaffl method equation (equation 2 [17]) also works with both ∆Cq and ∆∆Cq values (see [15] for mathematical exposition).
The technique of qPCR occupies a central position in the work flow, preceded by the design and execution of the main experiment and extraction of nucleic acid. qPCR is then followed by the analysis of data and finally the post-hoc calculation of a relative expression value (Fig. 1). Though these steps are separated by qPCR, they are in fact linked, in that experimental design dictates how gene expression should be analyzed and relative expression determined. It is worth noting that the commonly used models, specifically the \( {2}^{-\Delta \Delta {C}_q} \) method [11] (2001; over 106,5000 citations as of March 2020) and the Pfaffl method [17] (2001; over 26,000 citations as of March 2020), were developed to analyze paired experimental designs. In this case, the experimental design is paired in nature, and so then would be the analysis. Paired models have their place and have proved very useful in determining expression of a gene 1) before and after treatment or 2) between two tissue types within the same organism. However, many types of experimental designs exist beyond paired designs that can be used to address a multitude of experimental questions. Such questions suggest the need for the development of alternative approaches.

Work flow for an experiment showing main experiment, qPCR experiment, and the common base method (with statistical testing and the visualization of the relative expression value)
The common base method for the analysis of qPCR data [18] has inherent advantages over traditional methodologies and lends itself for use with other types of analyses within the general linear model (Fig. 2). Here we further develop statistical methodologies for unpaired models with a focus on linear relationships, specifically regression and analysis of covariance (ANCOVA). As with the common base method [18], we work with efficiency-weighted ∆Cq values and develop relative expression calculations with associated confidence intervals post hoc.

Representations of (a) paired model with associated \( \Delta {C}_q^{(w)} \) and \( \Delta \Delta {C}_q^{(w)} \) values and (b) unpaired model with associated \( \Delta {C}_q^{(w)} \) and \( \Delta \Delta {C}_q^{(w)} \) values where treatment variables are categorical
The Common Base method
The common base method calculations are kept in the logscale for as long as possible. Remaining in the logscale allows for the use of the more familiar arithmetic mean instead of the geometric mean and permits the use of parametric statistics [18]. Any choice of base for a logarithm may be made as long as it is used consistently. We have chosen to use base-10 logarithms throughout this work.
The common base method uses Cq and Efficiency (E) values to calculate an efficiency-weighted \( {C}_q^{(w)} \) value. Let r denote a particular biological replicate, t denote a sample type, and g denote a particular gene (equation 3).
The \( {C}_{q;r,t,g}^{(w)} \) value is then normalized using a reference gene or genes, where GOI is the gene of interest and REF is a reference gene (equation 4 [18];).
The advantage of such values is that each efficiency-weighted ∆Cq value can be treated separately in unpaired models that incorporate categorical and/or continuous variables. The major goal of our work here is to show that the common base method can be expanded to other statistical tools, including regression and analysis of covariance (ANCOVA). We will provide the mathematical approach for consideration of linear relationships, where at least one of the variables is \( {\Delta C}_q^{(w)} \), including calculation of \( \Delta \Delta {C}_q^{(w)} \) values, relative expression ratios, and associated confidence intervals. We begin with regression and proceed into ANCOVA.
Results
\( {\Delta C}_q^{(w)} \) as the Dependent Variable.
We begin with consideration of the case where the dependent variable (y) is \( {\Delta C}_q^{(w)} \), while the independent is a non-gene expression variable (x). For example, consider the concentration of a hypothetical hormone α1 in plant leaves and expression of gene G in these same leaves, using \( {\Delta C}_q^{(w)} \) of G. We may be interested in how these two variables are related. For each individual, we could measure both α1 concentration and quantify, through qPCR, an efficiency-weighted Cq of gene G as \( {\Delta C}_q^{(w)} \). Suppose that all necessary assumptions for a regression (linearity, homoscedasticity, independence, and normality) have been met by our data set. Note that the assumptions of regression analysis are covered in any introductory statistics text.
Once the regression analysis has been performed, it is now possible to calculate relative expression ratios as a function of hormone concentration along with associated confidence intervals. As discussed earlier, in unpaired models \( \Delta {\Delta C}_q^{(w)} \) values are used to calculate relative expression ratios (R) after statistical analyses have occurred (Fig. 2).
Suppose the line of best fit is of the form.
where \( \hat{y} \) is used to denote the predicted value of \( {\Delta C}_q^{(w)} \) given a value of x based on the linear equation (Fig. 3a).

(a) Layout of regression showing variables used in calculations. (b) Representation of calculated \( \hat{\Delta {\Delta C}_q^{(w)}} \)and \( \hat{R} \) values
We can then rework the linear equation into a form that will yield an equation whose input is the concentration of hormone α1 and whose output is a relative expression ratio R. We first must choose a fixed input concentration of hormone α1 to be a “baseline” level (x0) for comparison. For our example, let x0 be the mean α1 concentrationFootnote 1 found in the original experiment. Let
be the output predicted from the x0 concentration of hormone α1. We will now subtract (equation 6) from (equation 5) to produce an equation that outputs predictions for \( \Delta {\Delta C}_q^{(w)} \) values based on predicted \( {\Delta C}_q^{(w)} \) values and the choice of baseline x0 (Fig. 3b). In other words,
where each \( \Delta {\Delta C}_q^{(w)} \) uses the baseline concentration of hormone α1 and varies the chosen concentrations of hormone α1 within the range of values used in the experiment (Fig. 3b). By applying an exponential function to (equation 7), we arrive at an exponential equation for relative expression ratio using the baseline. As a formula,
In other words, from a plot of \( {\Delta C}_q^{(w)} \) and x (Figure 4a, Table 1), we have an equation that takes as input concentration x of hormone α1 and outputs a predicted \( \hat{R} \) that is relative to the baseline concentration of α1 x0 (Figure 4c, Table 1). Notice that using x = x0 as the input in (equation 8) predicts a relative expression ratio of 1, which is exactly as it should be. We can predict that a plant with a hormone concentration of 8.85 pg/mL would have an expression of Gene G that is 27% (\( \hat{R}=0.73\Big) \) lower than that of plants with average hormone concentration. (Any values for the independent variable may be chosen to predict R as long as they do not occur outside of the minimum and maximum values used in the study). It is important to note that relative expression plots tend to be inverse versions of \( {\Delta C}_q^{(w)} \) plots since high values of \( {\Delta C}_q^{(w)} \) indicate lower levels of gene expression than lower values.

Results of regression analysis between concentration of hormone α1 and \( \Delta {C}_q^{(w)} \) where the two variables are (a) highly correlated (r2 = 0.962) and (b) correlated (r2 = 0.709). Plot of predicted relative expression ratios (\( \hat{R} \)) for (c) regression in A with 95% confidence interval (CI) and for (d) regression in B with 95% confidence interval (CI). (e). Plot of predicted relative expression ratios (\( \hat{R} \)) based on a linear regression between concentration of hormone α1 and \( {\Delta C}_q^{(w)} \) with 95% confidence interval (CI). Relative expression and CI in (c and d) are based on comparisons to average concentration of hormone α1 measured, while (e) compares to the largest concentration of hormone α1 measured. Vertical dotted lines indicate x0
Confidence interval calculations from regression
While functions describing the relationship between two variables have great value, they only represent point estimates of output values for each input. However, assuming that the statistical assumptions for a valid regression have been met, one can also produce confidence intervalsFootnote 2 to envelope the point estimates resulting from the regression formula, allowing for meaningful error bars to be placed around point estimates. We will demonstrate that in order to calculate confidence intervals for relative expression value estimates, we first need to calculate the confidence intervals for \( \Delta {\Delta C}_q^{(w)} \). These confidence intervals are derived from the confidence interval around the regression slope m. Most statistical software tools (e.g., SPSS or Minitab), and even Excel, will compute the confidence interval for a regression slope as part of the standard regression output. This output is typically given as the low end and high end slope values of the 95% confidence interval in a form such as (L,U), though many tools allow for reporting of other confidence intervals. The formulas for L and U can be found in any introductory statistics textbook that covers inference related to linear regression.
We return to the setting where the concentration of hormone α1 x and \( {\Delta C}_q^{(w)} \) value y are linearly related and fit a linear formula as in (equation 5). Let x be an arbitrary input value in the range of data values collected in your study, and let x0 be the fixed baseline input value with associated linear output as in (equation 6). In our example, we fix x0 to be the mean value of x, but any fixed choice will work. Recall from (equation 7) that \( \hat{\Delta {\Delta C}_q^{(w)}}=m\left(x-{x}_0\right) \). Thus, the only random element in the estimate of \( \hat{\Delta {\Delta C}_q^{(w)}} \) is the slope m, and so the uncertainty of \( \hat{\Delta {\Delta C}_q^{(w)}} \) is solely a function of the uncertainty around m.
Suppose that the confidence interval (CI) on the slope parameter m is (L,U). Then the confidence interval for \( \hat{\Delta {\Delta C}_q^{(w)}} \) is given by.
depending upon whether (x − x0) is positive or negative for each x. In order to calculate the corresponding confidence interval for the predicted relative expression ratio \( \hat{R} \), we apply the exponential transformation to the interval calculated in (equation 9) (Fig. 4c) and mimic our end formula in (equation 8).
Depending upon whether (x0 − x) is positive or negative. (Notice the change in order of x and x0 made to match the order given in (equation 8).) From our example, the 95% confidence interval around our estimate of R given a hormone concentration of 8.85 pg/mL is 0.69–0.76 indicating relative expression of 69–76% compared to that of individuals with average hormone α1 concentration.
For any regression, r2 is an indication of the overall quality of the equation of the best fit line. Lower r2 values tend to increase the size of the confidence intervals around predicted relative expression ratios because as the r2 value lowers, the margin of error around the predicted slope value increases (Fig. 4b, d; Table 2).
A Comment on Choosing the Baseline Value for the Independent Variable.
Notice that the widths of our confidence intervals are functions of the distance between input x and the baseline value x0 (equation 10). The uncertainty that leads to the error for the estimates is solely due to uncertainty in the slope m, which means that the choice in baseline value x0 does not alter the uncertainty. However, the choice of x0 does play a role in how that uncertainty is translated into a confidence interval around a given \( \hat{\Delta {\Delta C}_q^{(w)}} \). As such, choosing x0 to be the mean value for x will result in overall smaller error bars and more symmetrically distributed error bars around estimates compared to choosing x0 to be one of the extreme values (minimum or maximum) (Fig. 4e; Table 3).
The selection of x0 should always be influenced by the experimental design. In our example, we selected the mean value of x for the baseline value x0 since values of hormone α1 concentration and \( {\Delta C}_q^{(w)} \) values were determined from randomly chosen plants. Suppose, however, that there is a tendency for the variable x to take on a certain value x0 in nature. If your experiment is to test the effects on gene expression by varying or manipulating the value of x, then it may make better sense to use the unmanipulated value x0 as the baseline in your calculations instead of the mean value of x, as that value serves as a natural point of comparison in your experiment. Such decisions should be made prudently.
In the absence of any other motivating factors or when the values of the independent variable will not be manipulated in the course of the experiment, we generally advocate choosing the mean value of x as the baseline value x0.
A comment on slope of the regression line
The p-value in a linear regression is used to test the null hypothesis m = 0. In our example above, we were able to reject the null hypothesis and obtained the formula (equation 8) as a result. Notice that if we were unable to reject the null hypothesis, we would be left with the assumption that the slope is not significantly different from zero, and (equation 6) would result in the constant function \( \hat{y}=b \), meaning that we have no evidence that the concentration of α1 has any effect on gene expression. (Equation 8) would yield \( \hat{R}=1 \), showing that changes in α1 concentration have no impact on the relative expression ratio for the gene in question.
\( {\Delta C}_q^{(w)} \) as the Independent Variable.
It may be of interest to determine the effect of the expression of a gene on some measureable quantity (y). Such an approach is common in experiments where the level of expression of a gene is explicitly manipulated either by varying the strength of the promoter or varying the number of gene copies. The result would be two values for each individual, the efficiency-weighted \( {\Delta C}_q^{(w)} \) for a particular gene or gene array and a response variable, y. For example, suppose that a particular gene’s expression is thought to correlate with promiscuity in a certain species of animal as measured by time (min.) spent huddling with their partner (conceptual example derived from [19]). In this case, we would be using \( {\Delta C}_q^{(w)} \) values as the independent variable x, and y (time spent huddling) would be the dependent. The mathematics for this case is the inverse of the case above.Footnote 3
Suppose that the assumptions for a valid linear regression have been met and produce a line of best fit with associated statistics (Fig. 5a, Table 4).
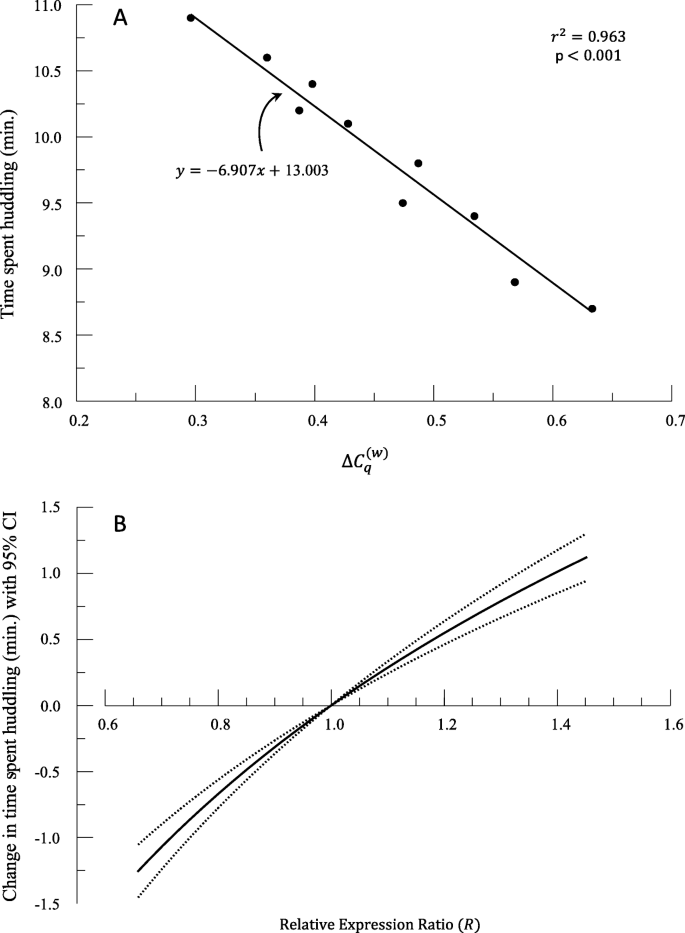
(A) Results of regression between \( \Delta {C}_q^{(w)} \) and T ime spent huddling. (B) Plot of predicted change in time spent huddling (min.) with 95% confidence interval (CI) based on relative expression ratio. x0 value is the average x
To calculate a functional form that involves relative expression ratios R and confidence intervals, one should judiciously choose a baseline value for gene expression \( {\Delta C}_q^{(w)} \), which we label as x0 for brevity. We set
and have \( \hat{y_0}=m{x}_0+b \). As relative expression ratio \( R={10}^{-\Delta {\Delta C}_q^{(w)}} \), we can solve for \( {\Delta \Delta C}_q^{(w)} \) in terms of R to see that
Therefore, subtracting \( \hat{y_0}=m{x}_0+b \) from (equation 11) yields the formula
We can rearrange that into a final form by adding \( \hat{y_0} \) to both sides of the equation
(Equation 15) tells us that for a given R, or relative expression ratio between two values (x and x0), we expect a specific change in time spent huddling (Fig. 5b, Table 4). In our hypothetical case, individuals with 50% higher expression of the promiscuity gene (R = 1.5) have an increase in huddling time of 73.0 s. Note that this value is only applicable to a comparison with the currently chosen x0; in other words, a 50% increase in expression relative to x0. If you require a different set of comparisons, then you will require a new baseline for comparison.
As with all predictions of y, we recommend confidence interval calculations. We can generate formulas for confidence intervals to place around predicted values of the dependent variable given values of R. Suppose that the confidence interval on the slope parameter m is (L, U). Substitute this expression into (equation 15) and simplify to calculate a confidence interval for \( \hat{y} \) based on a specified value of R.
where the order of L and U is swapped because of the negative multiplier in the formula. Given our hypothetical example above, the 95% CI for huddling time given a 50% increase in expression would be an increase in huddling time of 61.3 s – 84.6 s.
\( {\Delta C}_q^{(w)} \)as Both Independent and Dependent Variable.
Another useful technique might be to relate \( {\Delta C}_q^{(w)} \) values for two separate genes. This case is the intersection of the two cases listed above, but we include the derivation to make it explicit. The resulting regression would allow us to establish that the \( {\Delta C}_q^{(w)} \) of one gene is related to the \( {\Delta C}_q^{(w)} \) of a second gene. We may choose one of the gene’s \( {\Delta C}_q^{(w)} \) values to represent the independent variable (gene A) and the other’s \( {\Delta C}_q^{(w)} \) values to represent the dependent variable (gene B). The resulting model will show how a specific \( {\Delta C}_{q;A}^{(w)} \) value for gene A can be used to predict a \( {\Delta C}_{q;B}^{(w)} \) value for gene B. One can then also place a confidence interval around that prediction. On the other hand, one can swap the positions of the genes to make predictions of \( {\Delta C}_{q;A}^{(w)} \) values for gene A given \( {\Delta C}_{q;B}^{(w)} \) values for gene B and similarly place confidence intervals around the predictions. The choice in independent variable will give one value either for the regression slope or its reciprocal and will vary the margin of error for that slope resulting in different widths for the confidence intervals.
Suppose that the independent variable x is given by \( {\Delta C}_{q;A}^{(w)} \) describing expression of gene A and the dependent variable y is given by \( {\Delta C}_{q;B}^{(w)} \) describing expression of gene B. Suppose that a valid linear regression (Figure 6A, Table 5) has produced the formula

(A) Results of regression between \( \Delta {C}_q^{(w)} \) of gene B and \( \Delta {C}_q^{(w)} \) of gene A. (B) Plot of predicted relative expression ratio of gene B (\( \hat{R_B} \) ) with 95% confidence interval (CI) based on relative expression ratio of gene A (\( \hat{R_A} \) ) with 95% confidence interval (CI). x0 value is the mean x
We fix a baseline level for \( {\Delta C}_{q;A}^{(w)} \), which we label as x0, and get \( \hat{y_0}=m{x}_0+b \) as usual. Given \( {\Delta C}_{q;A}^{(w)}=x-{x}_0 \), we then subtract \( \hat{y_0}=m{x}_0+b \) from (equation 17) and use notation similar to (equation 12) for gene A and B to produce
Applying an exponential function to both sides and applying some algebra reveal
showing that the relative expression ratio for B is the mth power of the relative expression ratio for A in this case (Figure 6B, Table 5). From our example, individuals with 10% higher expression of gene A (RA = 1.1) are predicted to express gene B at a 3.6% higher rate (\( \hat{R_B}=1.036 \)) relative to individuals with average gene A expression.
Yet again we can generate formulas for confidence intervals for each value of \( \hat{R_B} \) predicted by a given value of RA. As in all earlier cases, all uncertainty derives directly from the uncertainty in the slope parameter. Suppose that the confidence interval on slope m is (L, U). Substitute this expression into (equation 19) and simplify to calculate a confidence interval for \( \hat{R_B} \) based on a specified value of RA (Figure 6B, Table 5).
depending upon whether RA > 1 or 0 < RA < 1. For our example, the 95% confidence interval around \( \hat{R_B} \) is 1.027–1.044, which corresponds to a predicted expression of gene B at 2.7–4.4% higher than that of individuals with average gene A expression.
A note on the assumption of linearity
There are important assumptions that must be met for regression analysis to be considered appropriate. These assumptions are covered in any general statistics text, and so we omit them here to conserve space. However, one of these assumptions, that of linearity, is worth discussing further. All of the work above assumes that there is a linear relationship between variable x and \( {\Delta C}_q^{(w)} \), \( {\Delta C}_q^{(w)} \) and variable y, or between \( {\Delta C}_{q;A}^{(w)} \) and \( {\Delta C}_{q;B}^{(w)} \). In these cases, the linear relationship between y and x resulted in either an exponential relationship between relative expression ratio R and x, a logarithmic relationship between R and y, or a power relationship between RA and RB. Theoretically, the functional relationships between measured variables and measures of gene expression (in our case the efficiency-weighted Cq, \( {\Delta C}_q^{(w)} \)) could assume any number of shapes depending on the gene of interest, the experimental condition, and even the species [5, 20], leading to other functional relationships between R and x, R and y, and RA and RB. In cases where x and y are not linearly related, it is common to apply transformations to the data to improve linearity. A properly chosen transformation can allow for the linearity assumption to be met and a linear regression to be performed. However, the mathematical approach to calculating R is constrained by the specific transformation that was chosen.
The common base method is amenable for considering many functional types; however, for this paper we focus on only a few cases that we hope will illustrate the general concept. Above, we developed the calculations for the relationship between relative expression ratio R and an independent variable x that is exponential (R = kbx) when \( {\Delta C}_q^{(w)} \) and x are linearly related. We also developed a logarithmic formula y = a + b*log(R) for linear relationships between a dependent variable y and R when they are linearly related. We finally showed that a power function (\( {R}_B={R}_A^m \)) results when \( {\Delta C}_{q;A}^{(w)} \) and \( {\Delta C}_{q;B}^{(w)} \) are linearly related.
\( {\Delta C}_q^{(w)} \) as the Dependent Variable and Log-Transformed x.
Earlier we showed how linear relationships between \( {\Delta C}_q^{(w)} \) and another variable resulted in exponential or logarithmic relationships. We now develop the calculations to show that power functions (R = kxa), including linear proportions (R = kx) as a special case when a = 1, occur when \( {\Delta C}_q^{(w)} \) and log(x) have a linear relationship. Suppose that such a linear relationship exists.
In other words, suppose that the relationship between x and y is logarithmic (Figure 7A). Such plots are linearized by log-transformation of x (Figure 7B, Table 6). For example, suppose that expression of a particular bacterial gene is predicted by the density of the bacteria in culture. The function relating \( {\Delta C}_q^{(w)} \) to density of cells shows that \( {\Delta C}_q^{(w)} \) responds more to a change in density when the bacterial count is low than when the bacterial count is high.

(A) Plot of log rhythmic relationship between cells / nL and \( \Delta {C}_q^{(w)} \). (B) Results of regression analysis with log(cells/nL) and \( \Delta {C}_q^{(w)} \). (C) Plot of predicted relative expression ratio (\( \hat{R} \)) as a function of log(cells/nL) with 95% confidence interval. x0 value (vertical dotted line) is the mean x
Suppose then that log(x) (log (number of cells / nL)) and y (\( {\Delta C}_q^{(w)} \)) fit a linear relationship with the line of best fit
We again choose a fixed baseline value x0 for the variable x and subtract equations using inputs x and x0 as we did with (equation 5) and (equation 6) yielding
After applying the exponential transformation, we have
Using algebraic properties of the logarithm, we produce
In conclusion, when efficiency-weighted \( {\Delta C}_q^{(w)} \) values have a logarithmic relationship to x, then we obtain a power function relationship between relative expression ratio R and x (Figure 7C, Table 6).
Again, notice that inputting a concentration of hormone α1 x = x0 will result in a predicted relative expression ratio of 1 as we would expect.
In the case where log(x) and \( {\Delta C}_q^{(w)} \) are linearly related, the process for calculating a confidence interval only needs slight alterations compared to our first case. By tracking (equations 9, 23—27), we see that appending log() around each x or x0 will result in the correct formula. Therefore, we adjust (equation 10) and apply some algebraic properties of logarithms (as in (equation 26)) to obtain:
depending upon whether the ratio \( \frac{x_0}{x} \) is greater than 1 or less than 1 for each value of x, which in turn is equivalent to whether (x − x0) is positive or negative (Figure 8C). From our example above (Table 6), a concentration of cells of 70 cells / nL would be predicted to have a 7.7% lower expression (\( \hat{R}=0.923\Big) \) than cells at the average concentration of 140 cells / nL with a 95% CI of a decrease in expression of 7.3–8.2%.

(A) Plot of exponential relationship between \( \Delta {C}_q^{(w)} \) and y. (B) Results of regression analysis with \( \Delta {C}_q^{(w)} \) and log(y). (C) Plot of predicted y, \( \hat{y} \), as a function of relative expression ratio with 95% confidence interval. x0 value is the mean x
\( {\Delta C}_q^{(w)} \) as the Independent Variable and Log-Transformed y
Where the relationship between x and y is log-linear (Figure 8A, Table 7), it may be necessary to log transform the dependent y values to establish a linear relationship with \( {\Delta C}_q^{(w)} \) as the independent variable (Figure 8B). For example, in a species of insect, a particular gene is implicated in determining the size at pupation. Slight changes in gene expression at high expression levels have minimal effects on the size at pupation. However, at lower levels of expression, small changes in expression have disproportionate effects.
Suppose that the assumptions for a valid linear regression have been met with a line of best fit
Again, one should judiciously choose a baseline value for gene expression \( {\Delta C}_q^{(w)} \), which we label as x0. We again set
and have \( \log \left(\hat{y_0}\right)=m{x}_0+b \). Thus,
Subtracting the equation for \( \log \left(\hat{y_0}\right) \) from (equation 29) yields the formula
We apply some logarithmic properties to obtain the following:
Next, apply the exponential function.
Finally, solve for \( \hat{y} \) to obtain the power function (Figure 8C, Table 7):
This equation tells us that for a given R, or relative expression ratio between two values, we expect a specific change in response variable y (Figure 8C, Table 7). We can generate formulas for confidence intervals to place around predicted values of the dependent variable given values of R. Suppose that the confidence interval on the slope parameter m is (L, U). Substitute this expression into (equation 35) and simplify to calculate a confidence interval for \( \hat{y} \) based on a specified value of R.
depending on whichever interval is in the correct order. Given our example, a 10% higher level of expression (R = 1.1) predicts a decrease in length of larvae at pupation from 16.4 mm to 14.7 mm. The 95% CI for the length of the larva at pupation is 14.2–15.2 mm when expression is 10% higher than individuals with average expression. Note that these results are only applicable with the currently chosen x0.
Other cases
While we treated cases above where the non-gene variable needed to be log-transformed first to establish a linear relationship, we have not discussed cases where \( {\Delta C}_q^{(w)} \) needs such a log-transformation. Although we omit the derivations to conserve space, placing \( {\Delta C}_q^{(w)} \) inside of a logarithmic function, setting up a \( {\Delta \Delta C}_q^{(w)} \) formula, and then manipulating to convert \( {\Delta \Delta C}_q^{(w)} \) into relative expression ratio R will yield functional formulas that are “doubly exponential” or “doubly logarithmic.” While such formulas are not impossible, they do not appear to be common in nature. Another way to consider this situation is that since \( R={10}^{-\Delta {\Delta C}_q^{(w)}} \) with \( {\Delta \Delta C}_q^{(w)} \) in the exponent of R, we can view \( {\Delta \Delta C}_q^{(w)} \) as something that is already derived through a log-transformation applied to R. Thus, applying a logarithm to \( {\Delta C}_q^{(w)} \) would be like applying two layers of log transformations to R, which does not seem likely to be necessary.
On the other hand, one should not view an omission of any particular functional form in this work to represent a dismissal of that form as impossible. Nevertheless, our treatment of linear, exponential, logarithmic, and power forms covers the most common functional relationships curve shapes for two variables (Figure 9).

(A, B) Approximate curve shapes covered in this paper by the common base method
Analysis of covariance
The common base method [18] may be used to perform paired and unpaired 2-sample t-tests and calculate 2-sample t-intervals as well as analysis of variance (ANOVA). These approaches can fail, however, when the quantities being compared between the groups are also affected by an uncontrolled quantitative covariate. In that case, analysis of covariance (ANCOVA) is a powerful analysis tool that combines ANOVA and linear regression techniques. In a simple, one-way ANCOVA, there will be three variables of interest: the factor or treatment effect (an independent categorical variable consisting of at least two groups), the response (a dependent quantitative variable), and a covariate (an independent quantitative variable).
For example, suppose that we have determined that \( {\Delta C}_q^{(w)} \) of a gene RT in larvae is affected by temperature. We might have a suspicion that RT expression is also affected by the larvae’s diet. We could perform an experiment at a single temperature where larvae are given an experimental and control diet. This would be a traditional use of qPCR and can be analyzed with the common base method as a 2-sample t-test. However, since we already know that temperature affects RT, we would be left wondering if the diet change was effective in altering RT expression across temperatures or if temperature and diet interact in some fashion. We could design an experiment that looks at both temperature and diet at the same time. Instead of designing an experiment with several larvae (replicates) in each combination of temperature and diet (two-factor ANOVA), we will instead grow larvae in three treatments: two experimental diets and one control diet across a range of temperatures (the covariate) in order to analyze the effect on expression of RT (the response).
Since we know from previous research that temperature and \( {\Delta C}_q^{(w)} \) of RT are related linearly, we really are not interested in performing another experiment to test this hypothesis. Instead we are interested in the effect of diet on \( {\Delta C}_q^{(w)} \) of RT, and we can determine if this effect is similar across temperatures or whether diet and temperature interact to alter \( {\Delta C}_q^{(w)} \) of RT. An ANCOVA is the obvious choice to test this hypothesis. Note that in our example above, temperature is manipulated by the researcher. However, covariates may also be unmanipulated variables that vary among individuals that are known to affect y.
The basic process for ANCOVA
(1) Perform separate linear regressions on the response as a function of the covariate for each of the treatment groups, and determine that at least one of those lines has a slope statistically different from zero. (If all slopes are zero, then the covariate may be ignored, and ordinary ANOVA used instead.)
(2) Verify homogeneity of slopes for the lines. Although it is unlikely that the regression step produced lines with identical slopes, it is possible that the data fit a model with an enforced common slope. Testing homogeneity of slopes relies on testing the significance of the interaction term between the treatment and covariate, diet*temperature in our example. Depending upon your choice of software, you will probably run some form of fit for a general linear model (possibly within an ANOVA menu) that accepts a response, treatment, and covariate. Often in an option for “model,” you can enter the interaction term. The resulting output should include a p-value for the interaction. The p-value for this interaction tests a null hypothesis that the slopes are the same. If the p-value is greater than 0.05, then you fail to reject the null hypothesis and may assume the slopes are homogeneous. If the p-value is smaller than 0.05, then the interaction between the treatment and covariate is significant, and so the slopes of the lines are likely different. In this case, ANCOVA is not appropriate.
(3) Where slopes are homogeneous, rerun the general linear model routine but without the interaction term in order to recalculate the regression lines with a new enforced common slope. Most software packages should also offer options for “contrasts” or “comparisons” that will generate confidence intervals for pairwise comparisons between treatments. We will avoid dictating which of the many types of contrasts (Fisher, Tukey, Sidak, or Bonferonni) is preferable.
Relative expression ratios and confidence intervals from ANCOVA
Suppose that all three steps above have gone correctly and that for the three treatments we now have regression lines that share an enforced common slope. Notice that the slope, m, is the same for each equation.
Then the differences in the lines are measured by b2 − b1, b3 − b1, and b3 − b2 respectively.
In our example, x stands for temperature while y stands for the \( {\Delta C}_q^{(w)} \) of RT. We use the subscripts c to denote control diet and t1 and t2 to denote treatment diets. Since the lines have the same slope, they are all parallel, and each pair has a constant vertical difference given by the difference between intercept values: bt1 − bc, bt2 − bc, and bt2 − bt1. As that difference is a measurement on the y-scale, it represents a predicted \( \hat{\Delta {\Delta C}_q^{(w)}} \) measurement (Figure 10). For example, bt1 − bc and its confidence interval predict the effect on \( {\Delta C}_q^{(w)} \) between treatment1 and the control at any given value x of the covariate. In our example, we are calculating the effect that the two different diets have on expression of the gene RT while controlling for temperature.

ANCOVA plot using data from Table 8. Plotted regression lines use the common slope of 0.033
We may now calculate a predicted relative expression ratio \( \hat{R} \) showing the difference in any pair of factors (e.g., treatment1 effect relative to the control on the gene) at any given covariate value.
Similar to our regression analysis, we may also calculate a confidence interval for this predicted relative expression ratio using (equation 38) and the confidence interval (L,U) calculated for the difference bi − bj between any two factors.
where the order of L and U has switched because of the negative multiplier in the exponential function.
For our example data (Table 8), a check of the homogeneity of slopes assumption shows that we can treat our lines as parallel (p = 0.613). Rerunning the analysis without the interaction term shows that both temperature and diet affect \( {\Delta C}_q^{(w)} \). Post-hoc analysis shows that the treatment diets were both significantly different from the control (p < 0.001), but the two treatment diets were not different from each other (p = 0.829). Larvae exposed to the treatment1 diet expressed RT at a level 194% higher than in the control (95% CI = 181—207%; Figure 11). Larvae exposed to the treatment2 diet expressed RT at a level 192% higher than in the control (95% CI = 181—207%; Figure 11). With no difference in RT expression between the two treatments the 95% CI for relative expression comparing treatment2 to treatment1 (\( \hat{R} \) = 0.993) overlaps 1 with the 95% CI = 0.930—1.061 (Figure 11).

Relative expression values with 95% confidence intervals for each post-hoc comparison (A, B, C)
One of the key assumptions of the ANCOVA process is that the slopes of the regression lines can be statistically treated as equal, even if they are not calculated to be exactly equal during individual regression analysis. The analysis generates a common slope for each trend line, and the differences between the intercepts derive from these rather than the original slope estimates. In our example above, the common slope is estimated to be 0.033. If this homogeneity assumption does not hold, then the ANCOVA cannot proceed as there is evidence that the difference between the lines is not constant with respect to the covariate.
Discussion
As you work through this approach, there are important things to consider.
1. It is preferable that the \( {\Delta C}_q^{(w)} \) values should be derived from efficiency (E) and Cq values from a single qPCR plate. Alternatively, each \( {\Delta C}_q^{(w)} \) value could be derived from a separate qPCR plate. The issue, though, is unexplained variation. Where \( {\Delta C}_q^{(w)} \) values derive from different plates, differences between these values may be attributable to differences among individuals, qPCR plates, wells on the plate, and the independent variable. Where \( {\Delta C}_q^{(w)} \) values derive from a single qPCR plate, variation is attributable to difference among individuals, wells on the plate, and the independent variable. If several \( {\Delta C}_q^{(w)} \) values are derived from a single qPCR plate, while several other values are derived from a second plate, then we cannot partition variation attributable to plate. The result, then, statistically is to increase the unexplained variation (reduce r2), which in turn increases our confidence intervals around our y estimates. Determining significance is more difficult where such an effect exists.
2. For production of the relative expression plots, only use x values within the range of x values used in the study or experiment.
3. Production of the linear equation through regression analysis allows us to determine y values given x values. Interpretation of this relationship depends upon the experimental design. Where x values are measured from randomly chosen individuals (unmanipulated), the relationship is predictive but not necessarily causal. Care should be exercised in such interpretations. Where x values are manipulated as part of an experiment, it may be appropriate to apply such causality.
4. Presentation of relative expression values should be accompanied by confidence intervals [18]. It is not enough to report the relative expression value since, depending on the tightness of the relationship, confidence can vary greatly.
5. Relative expression plots are based on an inverse axis—high \( {\Delta C}_q^{(w)} \) values represent lower expression than low \( {\Delta C}_q^{(w)} \) values. As such, all R plots should be interpreted with care.
6. It is important to check all of the assumptions for performing a linear regression. For publication, it is important for readers to see the regression relating \( {\Delta C}_q^{(w)} \) values to another variable. This allows readers to assess the linearity assumption. The R plot containing confidence intervals should also be presented for linear regression analyses. For ANCOVA results, the plot of \( {\Delta C}_q^{(w)} \) values by treatment against the covariate is valuable. Part of the calculation of \( {\Delta \Delta C}_q^{(w)} \) is to use b1 − b2. The difference between the y-intercepts is actually equal to the difference between the two regression lines at the average covariate value.
7. The experimental design and statistical approach should be addressed explicitly in the methods section. How are the \( {\Delta C}_q^{(w)} \) values analyzed? How are the \( {\Delta C}_q^{(w)} \) values manipulated to yield \( {\Delta \Delta C}_q^{(w)} \) values and ultimately yield relative expression values with associated confidence intervals? All too often such explanations are neglected, making it very difficult to evaluate the quality of the research.
Conclusion
Traditional qPCR analysis is not able to address statistical models other than the paired t-test. The common base method is amenable for use with any of the statistical models from the general linear model. Here we have shown how the common base method may be applied to determine relationships between \( {\Delta C}_q^{(w)} \) values and an independent variable, a dependent variable, or another gene’s \( {\Delta C}_q^{(w)} \) values. We have developed the concept of how to plot relative expression ratios R compared to an untransformed or log-transformed dependent or independent variable or to another relative expression ratio. In this manner, we can predict either how relative expression will change given a change in a measured variable, how a measured variable will change given an experimental change in expression, or how expression will change given a change in expression of a second gene.
Methods
Regression
In a simple linear regression analysis, we are attempting to determine if a linear relationship exists between two variables and, if so, describe the relationship. A linear regression analysis will return a linear equation y = mx + b connecting the two variables x and y. The analysis will at a minimum yield a coefficient of determination r2 and a p-value associated with the slope test. The r2 value is a number between 0 and 1 that indicates the amount of variation in y that can be explained by variation in x. The closer r2 is to 1, the better the linear relationship or fit between the two variables. The p-value is used to test whether or not the slope m is significantly different from zero.
In the results section we describe cases of linear regression where one of the variables is the efficiency-weighted \( {C}_q,{\Delta C}_q^{(w)} \). The ultimate goal will then be to show how such a regression line can be transformed into a nonlinear formula where one of the variables is a relative expression ratio R. To our best knowledge, conceptualization of relative expression ratios in this manner is novel.
Availability of data and materials
All data used are available in the manuscript.
Notes
The choice of baseline x0 will be discussed in a later section.
In linear regression, it is standard to have both confidence intervals and prediction intervals. We have chosen to use confidence intervals, but everything that we have developed can be used to calculate prediction intervals.
As the cases of \( {\Delta C}_q^{(w)} \) as dependent variable and \( {\Delta C}_q^{(w)} \) as independent variable are inverses, they each present essentially the same information but in two different manners. The nature of the experiment should help guide which approach is preferred. We advocate using \( {\Delta C}_q^{(w)} \) as the independent variable only in situations where \( {\Delta C}_q^{(w)} \) is a manipulated variable, i.e., the experimental design manipulated the level of some gene’s expression. Otherwise, we suggest relegating \( {\Delta C}_q^{(w)} \) to the dependent variable. When \( {\Delta C}_q^{(w)} \) is a dependent variable, you will be able to calculate a predicted relative expression ratio from a given input value x. When \( {\Delta C}_q^{(w)} \) is the independent variable, you will only be able to calculate a predicted change in variable y compared to a predicted baseline given an input relative expression ratio, instead of predicting an absolute calculation for y. The former situation is slightly easier to plot and describe.
Abbreviations
- ANCOVA:
-
Analysis of covariance
- ANOVA:
-
Analysis of variance
- GOI:
-
Gene of interest
- qPCR:
-
Quantitative polymerase chain reaction
- R :
-
Relative expression value
- REF:
-
Reference gene
References
Britten RJ, Davidson EH. Gene regulation of higher cells: a theory. Science. 1969;165:349–57.
Bustin S. Real-time quantitative PCR–opportunities and pitfalls. European Pharmaceutical Review. 2008;4:18–23.
DeRisi J, Penland L, Brown PO, Bittner ML, Meltzer PS, Ray M, Chen Y, Su YA, Trent JM. Use of a cDNA microarray to analyse gene expression patterns in human cancer. Nat Genet. 1996;14:457–60.
Cheung VG, Spielman RS. The genetics of variation in gene expression. Nat Genet. 2002;32:522–5.
Cheung VG, Nayak RR, Wang IX, Elwyn S, Cousing SM, Morley M, Spielman RS. Polymorphic cis- and trans-regulation of human gene expression. PLoS Biol. 2010;8:e1000480.
Lockhart DJ, Tinzeler EA. Genomics, gene expression and DNA arrays. Nature. 2000;405:827–36.
Pfaffl MW, Horgan GW, Dempfle L. Relative expression tool (REST ©) for group-wise comparison and statistical analysis of relative expression results in real-time PCR. Nucleic Acids Res. 2002;30:e36.
VanGuilder HD, Vrana KE, Freeman WM. Twenty-five years of quantitative PCR for gene expression analysis. BioTechniques. 2008;44:619–26.
Ruijter JM, Ramakers C, Hoogaars WMH, Karlen Y, Bakker O, van den Hoff MJB, Moorman AFM. Amplification efficiency: linking baseline and bias in the analysis of quantitative PCR data. Nucleic Acids Res. 2009;37:e45.
Derveaux S, Vandesompele J, Hellemans J. How to do successful gene expression analysis using real-time PCR. Methods. 2010;50:227–30.
Livak KJ, Schmittgen TD. Analysis of relative gene expression data using real-time quantitative PCR and the 2−∆∆CQ method. Methods 2001;25:402–408.
Freeman WM, Walker SJ, Vrana KE. Quantitative RT-PCR: pitfalls and potential. BioTechniques. 1999;26:112–25.
Ramakers C, Ruijter JM, Lekanne Deprez RH, Moorman AFM. Assumption free analysis of quantitative real-time polymerase chain reaction (PCR) data. Neurosci Lett. 2003;339:63–6.
Karlen Y, McNair A, Perseguers S, Mazza C, Mermod N. Statistical significance of quantitative PCR. BMC Bioinformatics. 2007;8:131.
Schefé JH, Lehmann KE, Buschmann IR, Unger T, Funk-Kaiser H. Quantitative real-time RT-PCR data analysis: current concepts and the novel “gene expression’s CQ difference” formula. J Mol Med. 2006;83:901–10.
Yuan JS, Want D, Steart CN Jr. Statistical methods for efficiency adjusted real-time PCR quantification. Biotechnol J. 2008;3:112–23.
Pfaffl MW. A new mathematical model for relative quantification in real-time RT-PCR. Nucleic Acids Res. 2001;29:2002–7.
Ganger MT, Dietz GD, Ewing SJ. A common base method for analysis of qPCR data and the application of simple blocking in qPCR experiments. BMC Bioinformatics. 2017;18:534.
Lim MM, Want Z, Olazábal DE, Ren X, Terwilliger EF. Young LJ. Enhanced partner preference in a promiscuous species by manipulating the expression of a single gene Nature. 2004;429:754–7.
Oleksiak MF, Churchill GA, Crawford DL. Variation in gene expression within and among natural populations. Nat Genet. 2002;32:261–6.
Acknowledgments
We thank J Sacco for helpful comments on the manuscript.
Funding
Financial support was provided by a Faculty Research Grant from Gannon University to GD. Gannon University had no role in the design or conclusions of this work.
Author information
Authors and Affiliations
Contributions
MG: Conceptualization, Methodology, Validation, Formal Analysis, Writing—Original Draft, Writing—Review & Editing, Visualization, Supervision. GD: Conceptualization, Methodology, Validation, Formal Analysis, Writing—Original Draft, Writing—Review & Editing, Visualization. PH: Conceptualization, Methodology, Formal Analysis, Writing—Review & Editing. SE: Conceptualization, Writing—Review & Editing. All authors have read and approved the manuscript.
Corresponding author
Ethics declarations
Ethics approval and consent to participate
Not applicable.
Consent for publication
Not applicable.
Competing interests
The authors declare that they have no competing interests.
Additional information
Publisher’s Note
Springer Nature remains neutral with regard to jurisdictional claims in published maps and institutional affiliations.
Rights and permissions
Open Access This article is licensed under a Creative Commons Attribution 4.0 International License, which permits use, sharing, adaptation, distribution and reproduction in any medium or format, as long as you give appropriate credit to the original author(s) and the source, provide a link to the Creative Commons licence, and indicate if changes were made. The images or other third party material in this article are included in the article's Creative Commons licence, unless indicated otherwise in a credit line to the material. If material is not included in the article's Creative Commons licence and your intended use is not permitted by statutory regulation or exceeds the permitted use, you will need to obtain permission directly from the copyright holder. To view a copy of this licence, visit http://creativecommons.org/licenses/by/4.0/. The Creative Commons Public Domain Dedication waiver (http://creativecommons.org/publicdomain/zero/1.0/) applies to the data made available in this article, unless otherwise stated in a credit line to the data.
About this article

Cite this article
Ganger, M.T., Dietz, G.D., Headley, P. et al. Application of the common base method to regression and analysis of covariance (ANCOVA) in qPCR experiments and subsequent relative expression calculation. BMC Bioinformatics 21, 423 (2020). https://doi.org/10.1186/s12859-020-03696-y
Received:
Accepted:
Published:
DOI: https://doi.org/10.1186/s12859-020-03696-y